Introduction
Accurate ECG interpretation remains a significant challenge for many clinicians, impacting the quality of cardiac care. Clinicians often struggle with the complexities of ECG waveform analysis. Let’s explore some best practices for reading heart rhythms together, offering insights into the essential components of ECG waveforms and a structured approach to interpretation. As technology advances and cardiac conditions become more complex, how can healthcare professionals keep up and improve their diagnostic accuracy? Failing to adapt could lead to misinterpretations and compromised patient care.
Understand ECG Waveform Components
Accurate ECG interpretation is crucial, especially when it comes to reading heart rhythms, yet many clinicians struggle with the complexities of waveform analysis. An ECG waveform comprises several critical components that reflect the heart's electrical activity during each heartbeat. The primary components include:
- P Wave: Represents atrial depolarization, marking the electrical impulse that initiates atrial contraction. A normal P signal is usually small and rounded, indicating healthy atrial function.
- QRS Complex: Reflects ventricular depolarization, essential for ventricular contraction. Characterized by a sharp spike, the QRS complex signifies rapid electrical activity in the ventricles, with abnormalities potentially indicating conduction delays or other cardiac issues.
- T Wave: Represents ventricular repolarization, illustrating the recovery process of the ventricles post-contraction. It is typically wider and more rounded than the P signal, with deviations such as an inverted T signal often indicating ischemia.
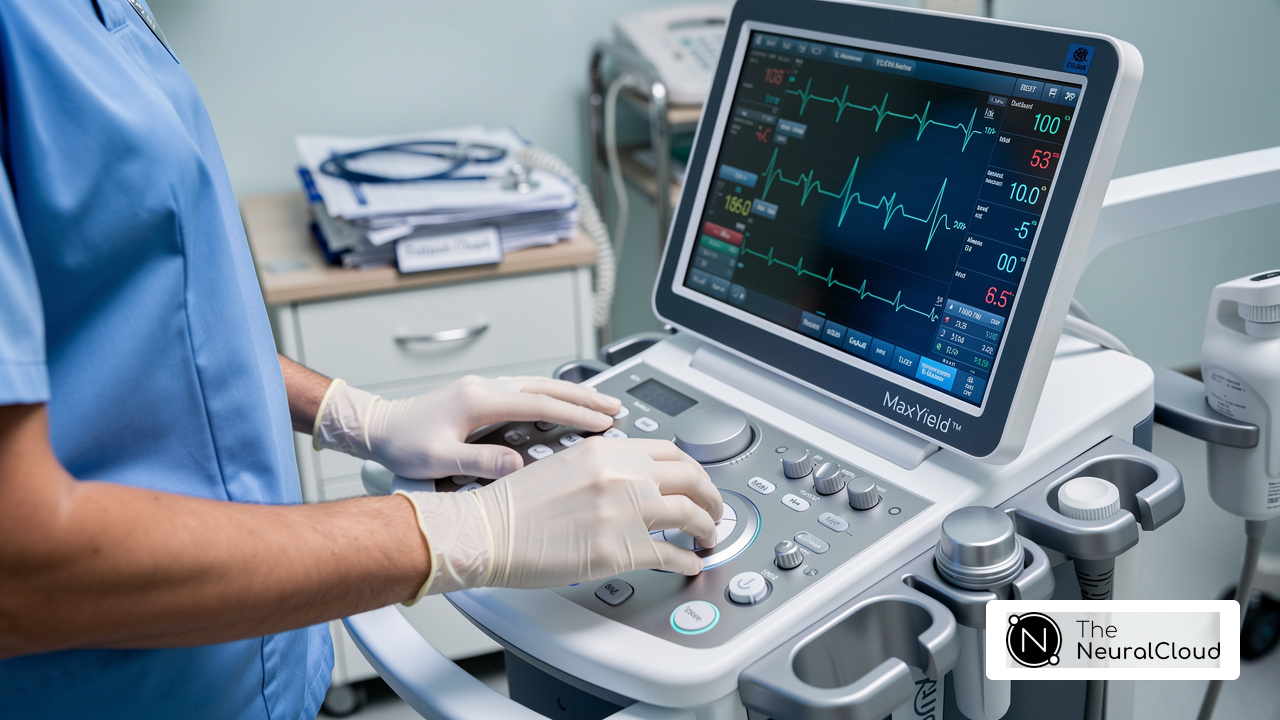
Grasping these components is essential for accurately reading heart rhythms and interpreting ECGs, as morphological deviations can indicate various cardiac conditions. For instance, a prolonged QRS complex may suggest a conduction delay, while an inverted T shape could indicate ischemia. Recent advancements in ECG interpretation, especially with AI-driven technologies like Neural Cloud Solutions' MaxYield™, significantly improve the detection of abnormalities. This allows for swift and accurate analysis. MaxYield™ automates noise reduction and provides beat-by-beat analysis, allowing clinicians to focus on critical insights without the distraction of signal artifacts. Additionally, the integration of Insight360 transforms MaxYield’s clean ECG data into interactive dashboards and clinical-ready reports, further enhancing workflow efficiency. Case studies have demonstrated that AI systems can outperform traditional methods in identifying high-risk patients, thereby improving clinical decision-making and patient outcomes. Knowing these components helps clinicians make informed decisions from ECG readings, which ultimately boosts cardiac care by reading heart rhythms.

Follow a Structured ECG Interpretation Process
To interpret an ECG effectively, follow a systematic approach that addresses common pitfalls in ECG analysis:
- Start by checking the quality of the ECG tracing to ensure accuracy: Ensure that the ECG is free from artifacts and that the leads are properly placed. Poor quality can lead to misinterpretation, which is a common cause of diagnostic errors in ECG interpretation.
- Next, calculate the heart rate to get a clearer picture of the heart's rhythm: Count the number of R-R intervals in a given time frame. For regular rhythms, apply the formula: 300 divided by the number of large squares between R peaks.
- Then, take a moment to analyze the rhythm for any irregularities: Identify whether the rhythm is regular or irregular. Look for consistent spacing between R peaks, as irregular rhythms may indicate underlying issues.
- Now, evaluate the P signals to assess atrial activity: Check for the presence of P signals before each QRS complex. Assess their morphology and duration to determine atrial activity, which is crucial for identifying arrhythmias.
- Next, measure the PR interval to check for conduction blocks: The PR interval should be between 120-200 ms. A prolonged interval may indicate a block in conduction, necessitating further investigation.
- Then, examine the QRS complex for any abnormalities: Measure the duration and morphology of the QRS complex. A normal duration is less than 120 ms; deviations can signal significant cardiac conditions.
- Finally, assess the T waves and ST segment for signs of ischemia: Look for abnormalities in the T wave and ST segment, which can indicate ischemia or other cardiac issues.
This organized method guarantees that all essential elements of the ECG are assessed, resulting in more precise diagnoses and improved outcomes for individuals. By following these best practices, healthcare providers can enhance their ECG interpretation skills, ultimately improving care and reducing the risk of misdiagnosis.

Identify Abnormal ECG Patterns and Their Implications
Recognizing abnormal ECG patterns is crucial, as they can signal serious cardiac conditions that require immediate attention. Here are some common abnormalities:
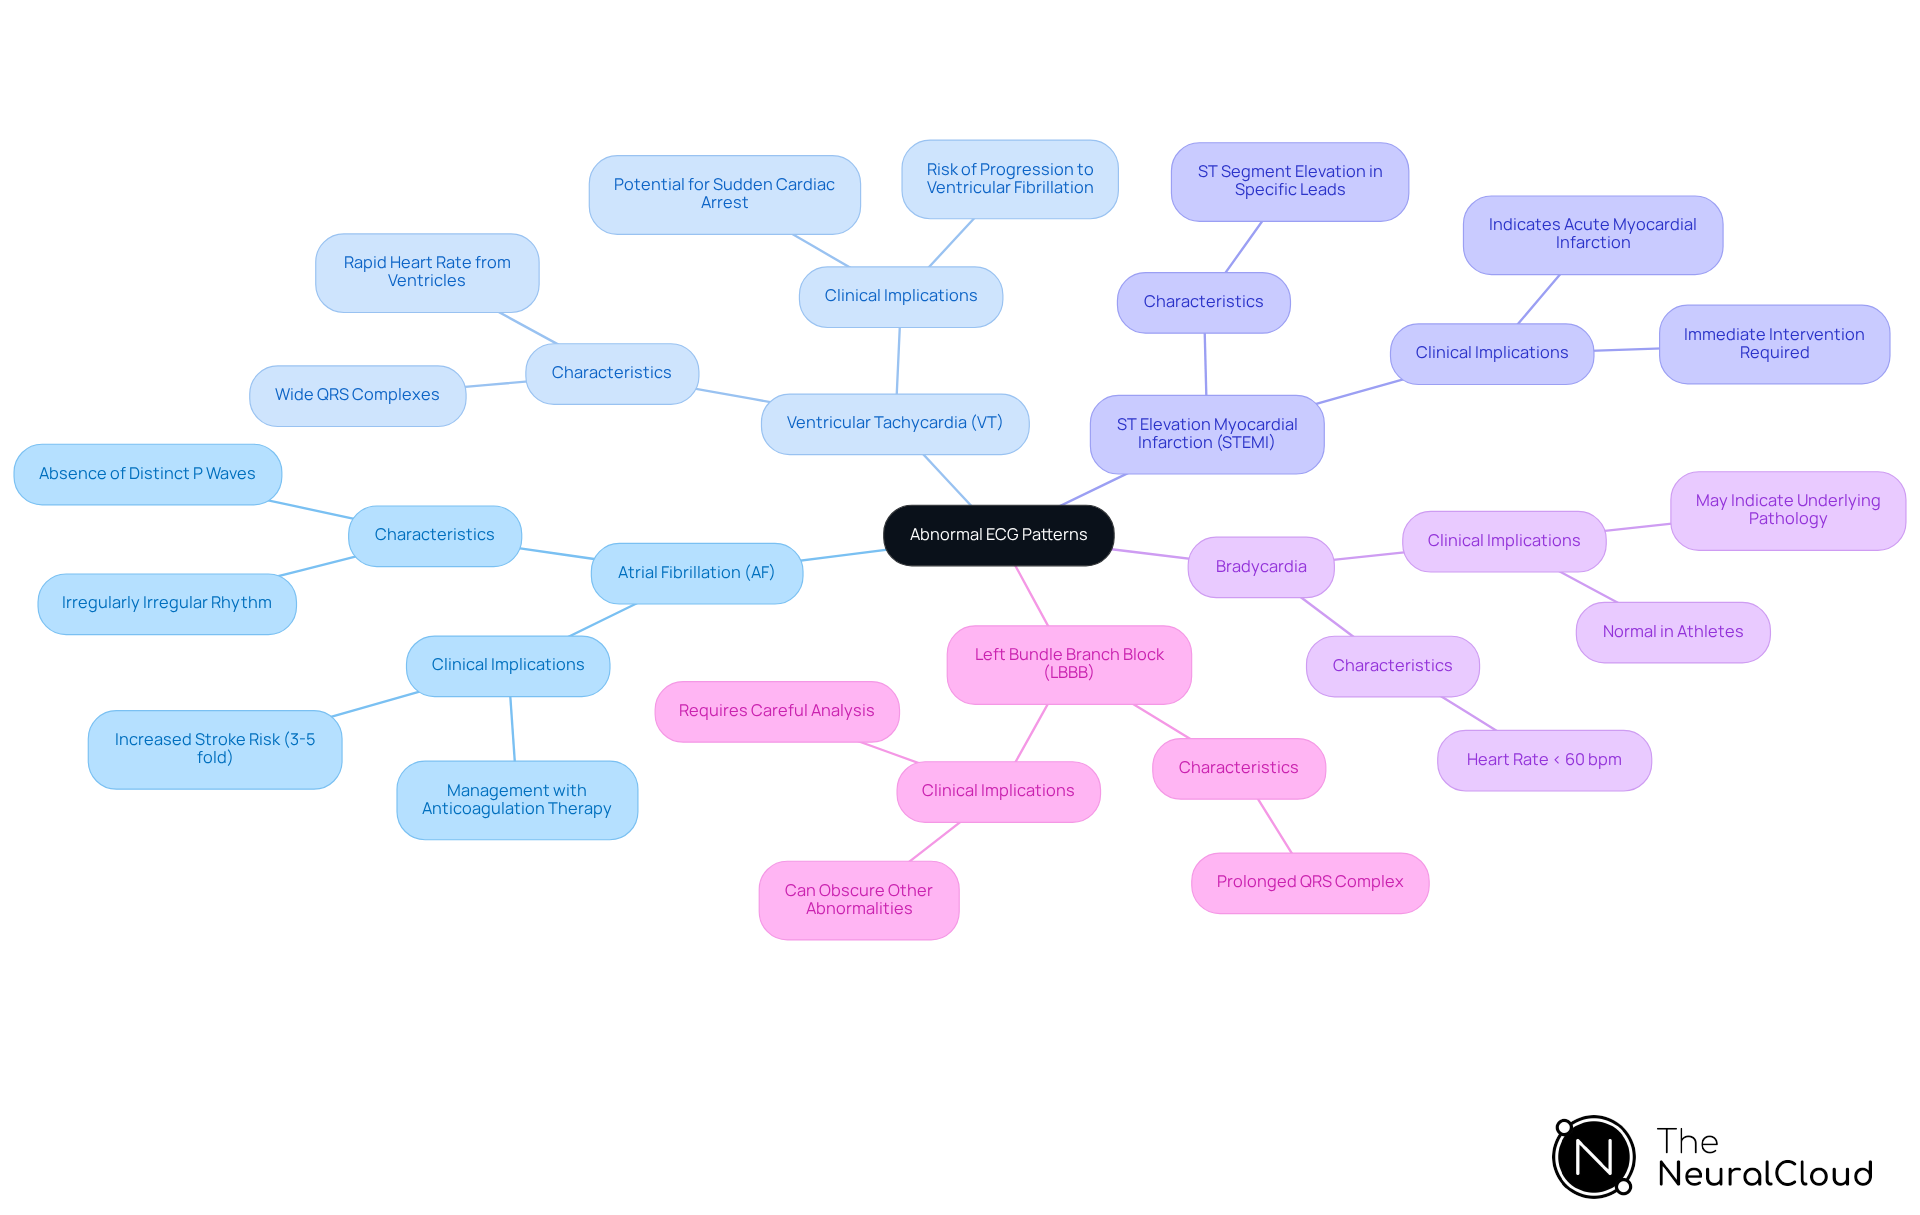
- Atrial Fibrillation (AF): Characterized by an irregularly irregular rhythm and the absence of distinct P waves, AF significantly increases the risk of stroke. Nonanticoagulated patients face a 3- to 5-fold higher risk. Effective management often requires anticoagulation therapy to mitigate these risks.
- Ventricular Tachycardia (VT): This condition presents as a rapid heart rate originating from the ventricles, typically shown as wide QRS complexes on the ECG. If not treated promptly, VT can progress to ventricular fibrillation, leading to sudden cardiac arrest.
- ST Elevation Myocardial Infarction (STEMI): Identified by ST segment elevation in specific leads, STEMI indicates an acute myocardial infarction. Immediate intervention is critical to restore blood flow and minimize heart damage.
- Bradycardia: Defined as a heart rate of less than 60 beats per minute, bradycardia may be normal in athletes but can signal underlying pathology in others, necessitating further evaluation.
- Left Bundle Branch Block (LBBB): Characterized by a prolonged QRS complex, LBBB can obscure other abnormalities, complicating interpretation and requiring careful analysis.
Understanding these patterns and their meanings in reading heart rhythms is vital for managing patient care effectively. Clinicians need to act quickly on their findings, using advanced tools like MaxYield and Insight360 to improve analysis and outcomes. MaxYield's advanced noise filtering and automated signal processing capabilities streamline ECG analysis, helping to overcome inefficiencies and physiological variability, ultimately leading to improved care for individuals.
Leverage Technology for Enhanced ECG Analysis
The interpretation of ECG data often faces challenges due to noise and complexity, but technology offers solutions to enhance clarity and accuracy. Here are some best practices for leveraging technology effectively:
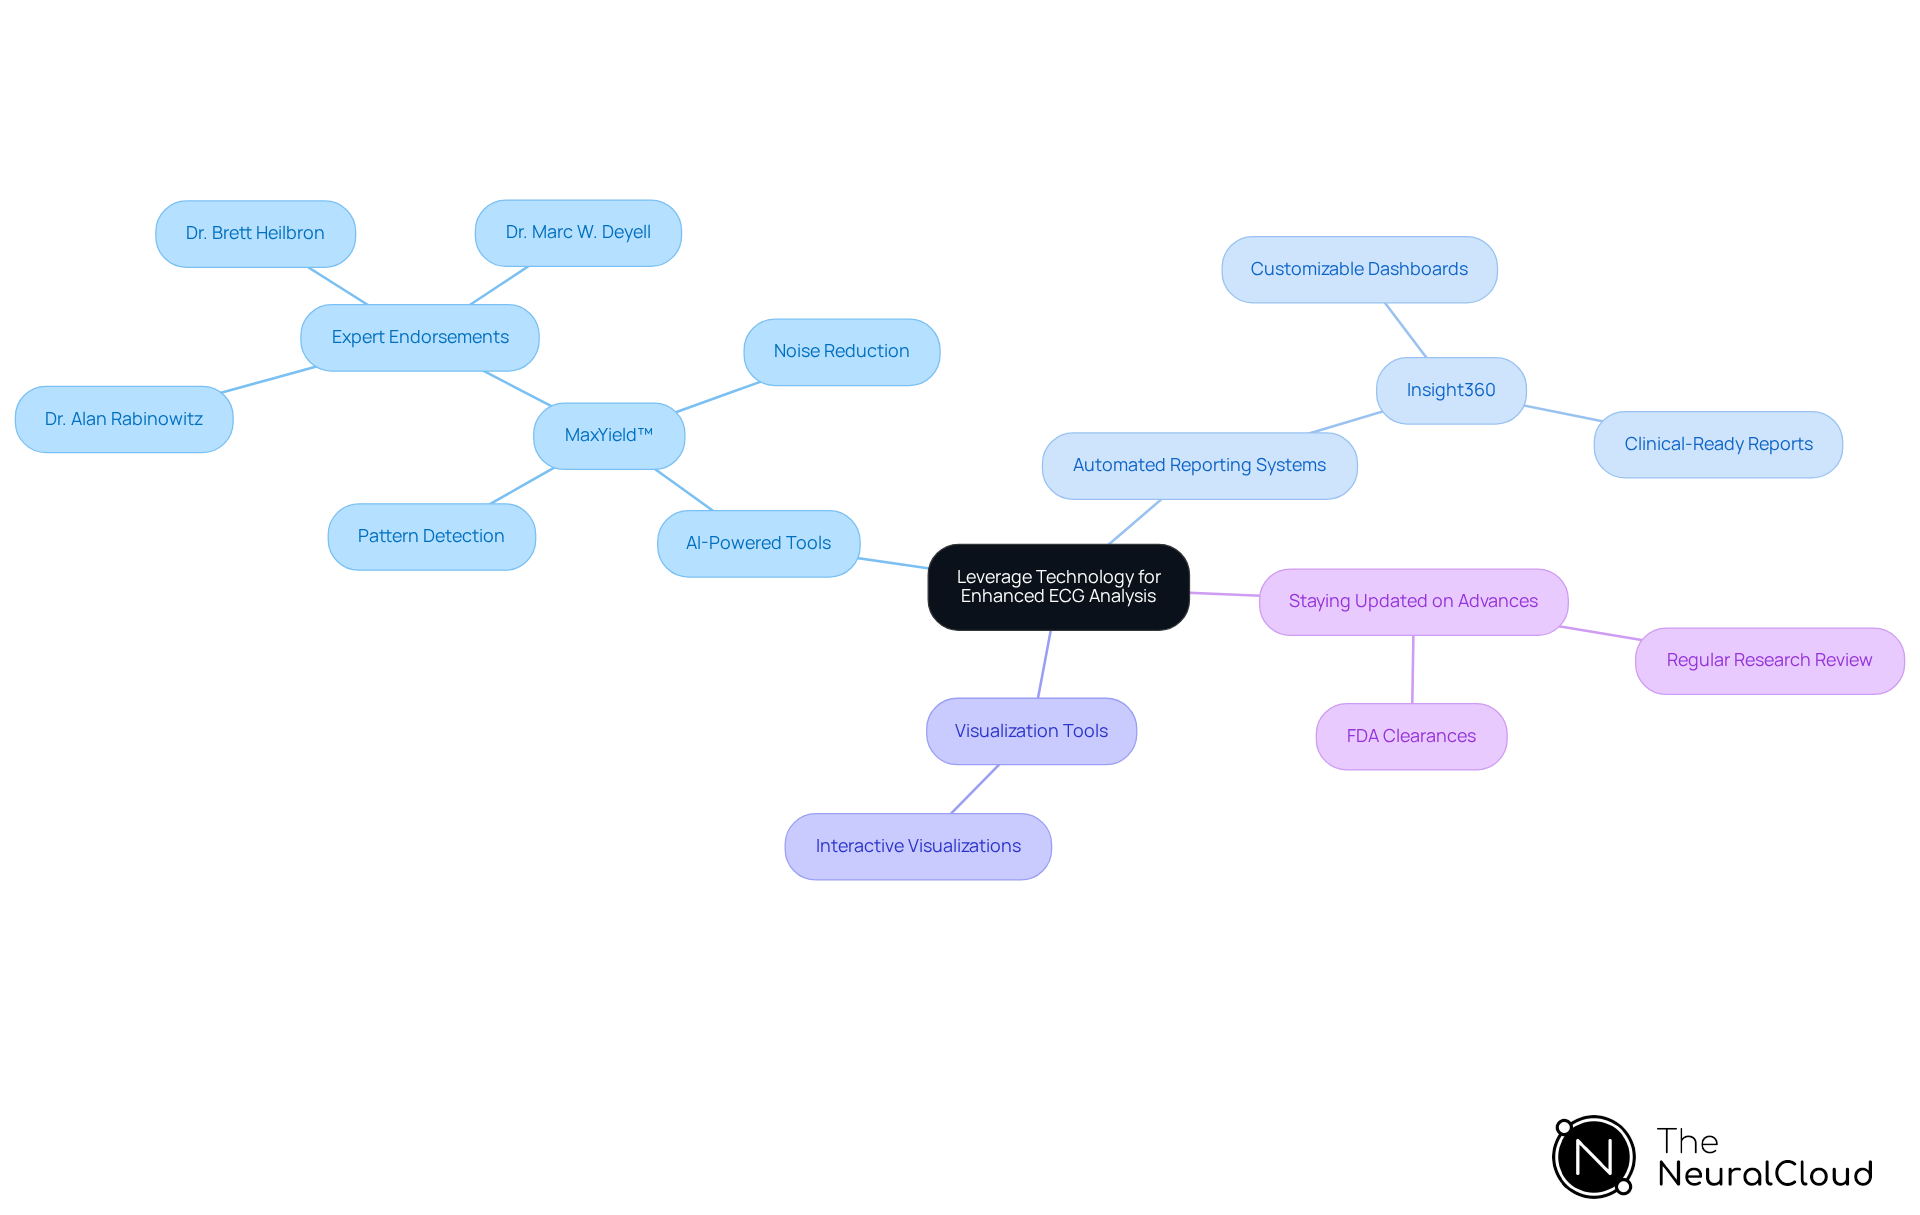
- Utilize AI-Powered Tools: Solutions like MaxYield™ enhance ECG interpretation by isolating and cleaning noisy signals, resulting in clearer data for analysis. MaxYield™ acts as a flexible ECG intelligence layer that easily connects with various systems through APIs, SDKs, or CDKs, enabling users to analyze more data in less time. AI algorithms excel at detecting patterns that may elude the human eye, thereby improving diagnostic accuracy. Expert endorsements from Dr. Alan Rabinowitz, Dr. Brett Heilbron, and Dr. Marc W. Deyell emphasize MaxYield’s precision rivaling human interpretation and its noise reduction benefits.
- Implement Automated Reporting Systems: Employ software that generates automated reports based on ECG findings. This approach not only saves time but also ensures consistency in reporting, which is crucial for maintaining high standards in clinical practice. With Insight360, you can create customizable dashboards and clinical-ready reports that transform MaxYield™’s clean ECG data into interactive visualizations.
- Integrate Visualization Tools: Utilize platforms like Insight360 to create customizable dashboards and reports. These visualization tools enable clinicians to quickly visualize trends and make data-driven decisions, enhancing the overall efficiency of ECG analysis.
- Stay Updated on Technological Advances: Regularly review the latest research and advancements in ECG technology. Comprehending new tools and methodologies can significantly enhance clinical practice and improve care for individuals. For example, the recent FDA clearances for innovative ECG devices highlight the rapid evolution of the field, emphasizing the importance of staying informed.
By embracing these technological advancements, healthcare professionals can streamline workflows, reduce errors, and ultimately provide superior care for their patients. Exploring these technological advancements can lead to improved patient outcomes and more efficient clinical practices.
Conclusion
Clinicians face significant challenges in mastering ECG interpretation, which is crucial for enhancing patient care and outcomes. By understanding ECG waveforms, following a structured interpretation process, recognizing abnormal patterns, and leveraging advanced technology, healthcare professionals can significantly improve their diagnostic accuracy and efficiency.
Key insights from this article include:
- The importance of a systematic approach to ECG analysis.
- Assessing waveform components.
- Calculating heart rates.
- Identifying irregularities.
Additionally, recognizing common abnormalities such as atrial fibrillation and ventricular tachycardia is crucial for timely intervention. The integration of AI-powered tools like MaxYield™ and visualization platforms such as Insight360 further empowers clinicians to streamline their workflows and enhance the clarity of ECG data.
By embracing these advancements, healthcare professionals can transform their approach to cardiac care, ultimately leading to improved patient outcomes. Committing to continuous learning and adaptation in this rapidly evolving field ensures that healthcare professionals are equipped to provide the highest level of care for their patients, ultimately leading to better health outcomes and a more efficient healthcare system.
Frequently Asked Questions
What are the main components of an ECG waveform?
The main components of an ECG waveform include the P Wave, QRS Complex, and T Wave. The P Wave represents atrial depolarization, the QRS Complex reflects ventricular depolarization, and the T Wave indicates ventricular repolarization.
What does the P Wave signify in an ECG?
The P Wave signifies atrial depolarization, marking the electrical impulse that initiates atrial contraction. A normal P signal is typically small and rounded, indicating healthy atrial function.
What is the significance of the QRS Complex in an ECG?
The QRS Complex reflects ventricular depolarization, which is essential for ventricular contraction. It is characterized by a sharp spike, indicating rapid electrical activity in the ventricles. Abnormalities in the QRS Complex may suggest conduction delays or other cardiac issues.
What does the T Wave represent in an ECG?
The T Wave represents ventricular repolarization, illustrating the recovery process of the ventricles after contraction. It is usually wider and more rounded than the P signal, and deviations such as an inverted T signal can indicate ischemia.
Why is understanding ECG waveform components important for clinicians?
Understanding ECG waveform components is crucial for accurately reading heart rhythms and interpreting ECGs. Morphological deviations can indicate various cardiac conditions, helping clinicians make informed decisions that ultimately enhance cardiac care.
How do advancements in AI technology improve ECG interpretation?
Advancements in AI technology, such as Neural Cloud Solutions' MaxYield™, improve ECG interpretation by automating noise reduction and providing beat-by-beat analysis. This allows clinicians to focus on critical insights without distractions from signal artifacts.
What role does Insight360 play in ECG analysis?
Insight360 transforms the clean ECG data from MaxYield™ into interactive dashboards and clinical-ready reports, enhancing workflow efficiency for clinicians.
How do AI systems compare to traditional methods in identifying high-risk patients?
Case studies have shown that AI systems can outperform traditional methods in identifying high-risk patients, thereby improving clinical decision-making and patient outcomes.
List of Sources
- Understand ECG Waveform Components
- AI-ECG Momentum and Rising Competition Reshape Diagnostic Cardiology in 2026 (https://signifyresearch.net/insights/diagnostic-cardiology-market-bouncing-into-2026)
- With AI, researchers discover new way to detect sudden cardiac death risk - Berkeley News (https://news.berkeley.edu/2026/06/24/with-ai-researchers-discover-new-way-to-detect-sudden-cardiac-death-risk)
- AI and ECG Interpretation: The next era of cardiology starts here (https://clinicalview.gehealthcare.com/article/ai-and-ecg-interpretation-next-era-cardiology-starts-here)
- HeartBeam Receives FDA Clearance for First-Ever, Cable-Free Synthesized 12-Lead ECG for At-Home Arrhythmia Assessment (https://ir.heartbeam.com/news-events/press-releases/detail/107/heartbeam-receives-fda-clearance-for-first-ever-cable-free)
- Follow a Structured ECG Interpretation Process
- Electrocardiogram - StatPearls - NCBI Bookshelf (https://ncbi.nlm.nih.gov/books/NBK549803)
- Stepwise Approach to STAT ECGs Hub – ECG Weekly (https://ecgweekly.com/ecgstat/stepwise-ecg-interpretation)
- Identify Abnormal ECG Patterns and Their Implications
- New Study Links GLP-1 Medications to Lower Risk of Atrial Fibrillation, Independent of Weight Loss (https://hrsonline.org/news/glp1-medications-lower-afib-risk)
- Global surge in serious heart rhythm disorders sparks urgent call to action from experts: 1 in 3 people at risk (https://escardio.org/news/press/press-releases/global-surge-in-serious-heart-rhythm-disorders-sparks-urgent-call-to-action-from)
- One moment, please... (https://ccs.ca/guideline/2020-atrial-fibrillation/chapter-2-epidemiology)
- The Global Impact of Atrial Fibrillation (https://aerjournal.com/articles/global-impact-atrial-fibrillation?language_content_entity=en)
- Leverage Technology for Enhanced ECG Analysis
- ECG market keeps evolving thanks to AI, home monitoring and Epic integration (https://cardiovascularbusiness.com/topics/cardiac-imaging/electrocardiography-ecg/ecg-market-keeps-evolving-thanks-ai-home-monitoring-and-epic-integration)
- PMcardio: AI ECG & Cardiac Care Platform (https://powerfulmedical.com)
- A sweeping new AI to detect heart conditions is coming to OpenEvidence (https://statnews.com/2026/06/23/pathway-labs-echonext-ai-tool-heart-disease-detection)
- AI-Powered ECG Analysis Offers Promising Path for Early Detection of Chronic Obstructive Pulmonary Disease, Say Mount Sinai Researchers (https://mountsinai.org/about/newsroom/2026/ai-powered-ecg-analysis-offers-promising-path-for-early-detection-of-chronic-obstructive-pulmonary-disease-say-mount-sinai-researchers)