Introduction
As the demand for precise cardiac assessments grows, developers face the challenge of mastering the complexities of electrocardiography (ECG). Understanding the intricacies of ECG is essential for creating effective diagnostic tools in the healthcare sector. The ability to interpret abnormal ECG graphs is increasingly critical. This article explores the fundamental aspects of ECG analysis, highlighting the latest advancements and tools that can empower developers to enhance clinical decision-making.
Developers often struggle with the intricacies of ECG data, which can be muddled by noise and artifacts. Without effective tools, the risk of misinterpretation increases, potentially jeopardizing patient care.
Explore the Basics of Electrocardiography and Its Clinical Importance
Despite its importance, ECG analysis often faces challenges that hinder accurate interpretation. Electrocardiography (ECG) serves as a crucial non-invasive method for recording the organ's electrical activity over time, providing essential insights into cardiac function. The ECG graph comprises key components: the P wave, QRS complex, and T wave, each corresponding to distinct phases of the heart's electrical cycle. A thorough understanding of these elements is crucial for accurate ECG interpretation, particularly in recognizing an abnormal ECG graph, which is fundamental in diagnosing various cardiac conditions.
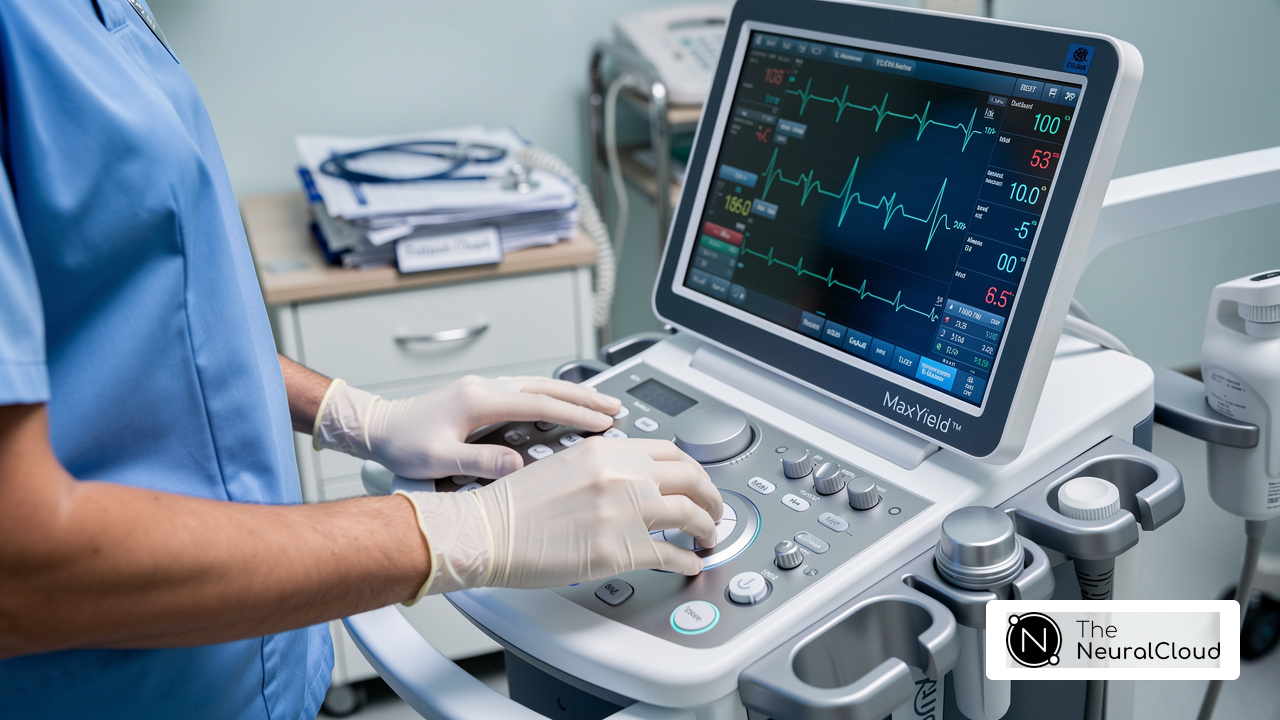
In clinical settings, ECGs are instrumental in identifying arrhythmias, myocardial infarctions, and other heart-related disorders, often revealed by an abnormal ECG graph. Healthcare professionals often struggle with motion noise and signal artifacts that compromise ECG accuracy. Recent advancements in ECG technology, especially with Neural Cloud Solutions' MaxYield platform, are transforming how healthcare professionals utilize this information. MaxYield tackles challenges like motion noise and signal artifacts, allowing for hospital-grade ECG accuracy even from consumer-grade devices. Its advanced noise reduction capabilities enable the isolation and labeling of critical ECG features, even in recordings with high levels of interference. This ensures that developers can integrate reliable ECG data into applications, enhancing clinical decision-making.
A notable example is HeartBeam, which received FDA clearance for its cable-free synthesized 12-lead ECG in December 2025, showcasing advancements in ECG technology. The MaxYield platform's automated analysis can process 200,000 heartbeats in less than five minutes, providing rapid insights that support timely interventions. Furthermore, MaxYield's device-agnostic ECG intelligence layer integrates seamlessly via API, SDK, or CDK without requiring hardware changes, making it a versatile solution for developers.
As the field evolves, staying abreast of current trends and technological innovations, such as the integration of MaxYield's capabilities, will be essential for enhancing patient outcomes and streamlining healthcare delivery. By leveraging MaxYield's capabilities, developers can significantly enhance the quality of clinical decision-making tools.

Identify Common Causes of Abnormal ECG Results
Abnormal ECG results can stem from various factors, each carrying significant clinical implications that demand precise interpretation:
- Arrhythmias: Irregular heartbeats, such as atrial fibrillation and ventricular tachycardia, can lead to abnormal waveforms on an ECG. These conditions affect approximately 1 in 3 people globally, highlighting the importance of accurate detection and management.
- Ischemia: Decreased blood flow to the cardiac muscle can lead to significant ST-segment alterations, which are essential signs of myocardial infarction. Timely recognition of these changes is essential for effective intervention.
- Electrolyte Imbalances: Conditions such as hyperkalemia or hypokalemia can significantly change ECG patterns, affecting the organ's electrical activity. These imbalances can arise from various health issues and may be indicated by an abnormal ECG graph, necessitating careful monitoring.
- Structural Cardiac Disease: Conditions such as hypertrophic cardiomyopathy or valvular cardiac disease can present as an abnormal ECG graph, which necessitates further diagnostic evaluation to determine appropriate treatment.
- Medications: Certain drugs can influence heart rhythm and conduction, leading to abnormal readings. It is crucial for healthcare providers to review patient medications when interpreting ECG results.
Understanding these causes helps developers create better diagnostic tools that can spot potential issues in ECG data, ultimately enhancing patient care and outcomes. Using Neural Cloud Solutions' MaxYield™ platform, currently awaiting FDA Class II SaMD clearance, developers can improve their analysis with advanced noise filtering and automated signal processing. Additionally, the Insight360 tool converts MaxYield’s clean ECG information into interactive dashboards and clinical-ready reports, addressing challenges such as physiological variability and signal artifacts. This integration not only streamlines workflow efficiency but also ensures that the ECG data is clean and reliable for accurate diagnostics. Ultimately, the integration of advanced tools like MaxYield™ can transform ECG analysis, leading to better patient management and outcomes.

Analyze Key Metrics and Waveforms in ECG Interpretation
Accurate ECG interpretation is vital for effective cardiac assessment, yet many face challenges in monitoring key metrics. Key metrics and waveforms in ECG interpretation are essential for accurate cardiac assessment and include the following:
- Heart Rate: This is determined by counting the number of R waves within a specific time frame. Irregular pulse rates can suggest conditions such as tachycardia (elevated pulse rate) or bradycardia (decreased pulse rate). The prevalence of arrhythmias underscores the critical need for accurate ECG monitoring, impacting more than 4 million individuals in the U.S. each year. With MaxYield™, you get a beat-by-beat evaluation that makes monitoring much easier, enabling quick detection of abnormal pulse rates.
- PR Interval: This metric measures the duration from the onset of the P wave to the beginning of the QRS complex, providing insights into atrioventricular conduction. A prolonged PR interval, greater than 200 ms, raises the risk of heart failure by 46%, highlighting its clinical significance. MaxYield™ automates the labeling of this interval, ensuring precise measurements that support clinical decision-making.
- QRS Duration: The width of the QRS complex reflects the time taken for ventricular depolarization. An extended QRS duration can indicate the presence of bundle branch blocks, which may affect cardiac function and lead to adverse outcomes. With MaxYield™, developers can integrate advanced algorithms that enhance the accuracy of QRS duration assessments.
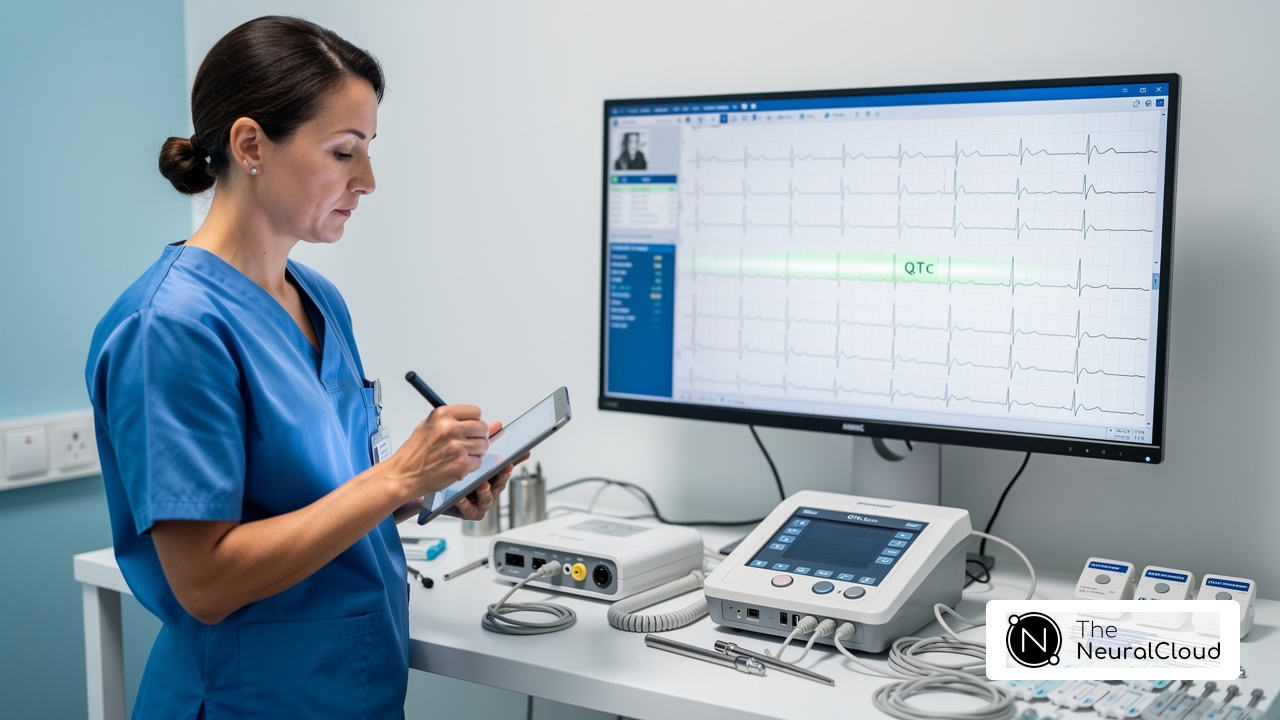
- QT Interval: This interval spans from the start of the Q wave to the end of the T wave and is critical for evaluating the risk of arrhythmias. Prolonged QT intervals can lead to serious cardiac events, necessitating careful monitoring. MaxYield™ automates noise reduction, which boosts the reliability of QT interval measurements.
- ST Segment: Changes in the ST segment can indicate ischemia or myocardial infarction, making it a crucial area for examination in ECG interpretation. MaxYield™ assists healthcare professionals by providing clean signals and clear information, enabling improved examination of the ST segment.
Furthermore, Insight360 acts as a customizable visualization tool that converts MaxYield’s clean ECG data into interactive dashboards and clinical-ready reports, improving the overall evaluation experience. Developers should prioritize these metrics when creating ECG evaluation tools, ensuring their applications deliver precise and actionable insights that enhance cardiac care and patient outcomes. The evolving market for ECG systems, driven by advancements in technology and increasing demand for accurate diagnostics, further emphasizes the need for robust ECG interpretation capabilities. By leveraging MaxYield™, developers can create scalable, automated solutions that address physiological variability and signal artifacts, ultimately improving clinical workflows. Moreover, it is crucial to take into account regulatory compliance, including FDA Class II SaMD clearance-pending status, to ensure the credibility and reliability of the ECG evaluation tools developed. Incorporating MaxYield™ into ECG evaluation tools not only enhances diagnostic accuracy but also elevates the standard of cardiac care.

Utilize Advanced Tools for Enhanced ECG Analysis and Interpretation
As the complexity of ECG analysis grows, healthcare professionals encounter significant challenges in accurate interpretation and timely decision-making. To enhance ECG analysis and interpretation, developers can leverage several advanced tools and technologies:
- AI and Machine Learning: Implementing AI algorithms significantly improves the accuracy of ECG interpretation by identifying patterns that may not be visible to the human eye. MaxYield™ utilizes advanced AI technology to convert extensive and noisy ECG recordings into clear, sharp signals, offering swift and accurate evaluations that compete with human interpretation.
- ECG Analysis Software: Platforms such as LabChart and BRAVEHEART provide automated ECG analysis capabilities, enabling real-time detection of abnormalities and facilitating quicker clinical decisions. These tools are essential for managing the growing volume and complexity of ECG information. MaxYield™ easily connects with your existing systems through API, SDK, or CDK, so you won’t need to change any hardware.
- Visualization Tools: Custom visualization tools like Insight360 present ECG information in a more interpretable format, transforming MaxYield’s clean ECG results into interactive dashboards and clinical-ready reports. This capability is essential for enhancing the speed and precision of ECG analysis, particularly in high-pressure clinical settings.
- Integration with Wearable Devices: Creating applications that handle information from wearable ECG monitors enables ongoing monitoring and early identification of cardiac problems. This integration is vital as it supports proactive patient management and enhances overall care coordination.
- Knowledge Graphs: Utilizing knowledge-driven frameworks can deepen the understanding of ECG data by contextualizing findings within a broader clinical framework. This approach aids in identifying critical insights that can lead to timely interventions.
By leveraging these advanced tools, healthcare professionals can enhance diagnostic accuracy and improve patient outcomes. Exploring these advanced tools could be the key to unlocking improved patient care and outcomes in the field of cardiology. Additionally, it is important to note that MaxYield™ is currently pending FDA Class II SaMD clearance, ensuring compliance with regulatory standards. For those interested in exploring these capabilities further, we invite you to contact Neural Cloud Solutions for free trials or personalized walkthroughs of MaxYield and Insight360.

Conclusion
Understanding abnormal ECG graphs is crucial for developers focused on improving cardiac care. By grasping the intricacies of electrocardiography and utilizing advanced tools like Neural Cloud Solutions' MaxYield, developers can significantly enhance the accuracy and reliability of ECG analysis. This helps healthcare professionals make better clinical decisions and improves patient outcomes.
The article explores the fundamental aspects of ECG interpretation, emphasizing the clinical importance of recognizing abnormal results and the common causes behind them. Key metrics such as heart rate, PR interval, QRS duration, QT interval, and ST segment changes are vital for accurate assessments. Moreover, the integration of AI and machine learning technologies, along with advanced visualization tools like Insight360, empowers developers to create robust applications that streamline ECG analysis and interpretation.
As cardiac care evolves, it's essential for developers to embrace advanced tools and technologies. By prioritizing the development of reliable ECG analysis solutions, developers can contribute to improved patient management and outcomes. Engaging with platforms like MaxYield not only enhances diagnostic capabilities but also sets a new standard in the field of electrocardiography, paving the way for a future where accurate and timely cardiac assessments are the norm.
Frequently Asked Questions
What is electrocardiography (ECG) and why is it clinically important?
Electrocardiography (ECG) is a non-invasive method for recording the electrical activity of the heart over time. It provides essential insights into cardiac function and is crucial for diagnosing various cardiac conditions.
What are the key components of an ECG graph?
The key components of an ECG graph include the P wave, QRS complex, and T wave, each corresponding to distinct phases of the heart's electrical cycle.
What challenges do healthcare professionals face when interpreting ECGs?
Healthcare professionals often encounter challenges such as motion noise and signal artifacts that can compromise the accuracy of ECG interpretation.
How does the MaxYield platform improve ECG analysis?
The MaxYield platform by Neural Cloud Solutions Inc. addresses challenges like motion noise and signal artifacts, allowing for hospital-grade ECG accuracy even from consumer-grade devices. Its advanced noise reduction capabilities help isolate and label critical ECG features in recordings with high interference.
Can you provide an example of recent advancements in ECG technology?
A notable example is HeartBeam, which received FDA clearance for its cable-free synthesized 12-lead ECG in December 2025, highlighting advancements in ECG technology.
How quickly can the MaxYield platform analyze ECG data?
The MaxYield platform can process 200,000 heartbeats in less than five minutes, providing rapid insights that support timely clinical interventions.
Is the MaxYield platform compatible with different devices?
Yes, MaxYield's device-agnostic ECG intelligence layer integrates seamlessly via API, SDK, or CDK without requiring hardware changes, making it a versatile solution for developers.
Why is it important for developers to leverage MaxYield's capabilities?
By leveraging MaxYield's capabilities, developers can significantly enhance the quality of clinical decision-making tools, ultimately improving patient outcomes and streamlining healthcare delivery.
List of Sources
- Explore the Basics of Electrocardiography and Its Clinical Importance
- AccurKardia (https://accurkardia.com/news)
- HeartBeam to Attend JP Morgan 2026 Annual Healthcare Conference (https://ir.heartbeam.com/news-events/press-releases/detail/108/heartbeam-to-attend-jp-morgan-2026-annual-healthcare)
- AI-ECG Momentum and Rising Competition Reshape Diagnostic Cardiology in 2026 (https://signifyresearch.net/insights/diagnostic-cardiology-market-bouncing-into-2026)
- Identify Common Causes of Abnormal ECG Results
- Interpreting Abnormal EKG Tests | EKG Results | The Heart House and Vascular Care (https://hearthousenj.com/treatment-options/cardiac-imaging-testing-diagnostics/abnormal-ekg)
- Next Steps After an Abnormal EKG: What You Need to Know | Joliet, IL (https://primarycarejoliet.com/blog/next-steps-after-an-abnormal-ekg-what-you-need-to-know)
- Abnormal EKG: What It Means and When to Worry (https://hospitalcmq.com/blog/abnormal-ekg)
- Global surge in serious heart rhythm disorders sparks urgent call to action from experts: 1 in 3 people at risk (https://escardio.org/news/press/press-releases/global-surge-in-serious-heart-rhythm-disorders-sparks-urgent-call-to-action-from)
- Abnormal EKG: Results, causes, and next steps (https://medicalnewstoday.com/articles/324922)
- Analyze Key Metrics and Waveforms in ECG Interpretation
- New Trends in the ECG Monitoring (https://dicardiology.com/article/new-trends-ecg-monitoring)
- AI-powered ECG analysis shows promise for early COPD detection (https://medicalxpress.com/news/2026-01-ai-powered-ecg-analysis-early.html)
- Basics of ECG Rhythm Interpretation 2026 Livestream (virtual) CNE Course Series | Mayo Clinic School of Continuous Professional Development | CNE Course Conference (https://ce.mayo.edu/nursing/content/basics-ecg-rhythm-interpretation-2026-livestream-virtual-cne-course-series)
- The Electrocardiographic PR Interval and Adverse Outcomes in Older Adults: the Health, Aging and Body Composition Study - PMC (https://pmc.ncbi.nlm.nih.gov/articles/PMC3613778)
- AI-ECG Momentum and Rising Competition Reshape Diagnostic Cardiology in 2026 (https://signifyresearch.net/insights/diagnostic-cardiology-market-bouncing-into-2026)
- Utilize Advanced Tools for Enhanced ECG Analysis and Interpretation
- ECG market keeps evolving thanks to AI, home monitoring and Epic integration (https://cardiovascularbusiness.com/topics/cardiac-imaging/electrocardiography-ecg/ecg-market-keeps-evolving-thanks-ai-home-monitoring-and-epic-integration)
- AI and ECG Interpretation: The next era of cardiology starts here (https://clinicalview.gehealthcare.com/article/ai-and-ecg-interpretation-next-era-cardiology-starts-here)
- AI-based ECG interpretation outperforms standard diagnosis of occlusive myocardial infarction (https://news-medical.net/news/20260323/AI-based-ECG-interpretation-outperforms-standard-diagnosis-of-occlusive-myocardial-infarction.aspx)
- AI-Based ECG Analysis Significantly Improves STEMI Detection, Reduces False Activations - American College of Cardiology (https://acc.org/latest-in-cardiology/articles/2025/10/24/16/56/tues-554pm-ai-tct-2025)