Introduction
Understanding the nuances of peaked T waves on an electrocardiogram (ECG) is crucial for healthcare professionals, especially in the context of hyperkalemia. These distinctive waveforms, often indicative of elevated potassium levels, can serve as warning signals for serious cardiac conditions. Clinicians face challenges in accurately interpreting these waveforms, which can lead to misdiagnosis or delayed treatment. To address these challenges, the integration of advanced technologies like the MaxYield™ platform offers a transformative approach to ECG analysis. This platform enhances diagnostic accuracy by providing detailed insights into T wave morphology and facilitating timely interventions.
The MaxYield™ platform boasts several key features that set it apart in ECG analysis.
- It utilizes advanced algorithms to analyze T wave patterns, enabling healthcare professionals to distinguish between normal and pathological forms with greater precision.
- The platform offers real-time data visualization, allowing clinicians to monitor changes in potassium levels effectively.
These features not only improve diagnostic capabilities but also empower healthcare providers to make informed decisions regarding patient care.
The advantages of utilizing the MaxYield™ platform are significant for healthcare professionals. By enhancing the accuracy of T wave analysis, clinicians can ensure timely and appropriate interventions for patients at risk of hyperkalemia. Additionally, the platform's user-friendly interface streamlines the workflow, saving valuable time during critical decision-making processes. Ultimately, the integration of such advanced technology into clinical practice can lead to improved patient outcomes and reduced risks associated with cardiac conditions.
In conclusion, understanding peaked T waves and leveraging the MaxYield™ platform can significantly enhance ECG analysis. As healthcare professionals navigate the complexities of cardiac diagnostics, embracing innovative solutions will be essential in providing optimal patient care.
Define Peaked T Waves: Normal vs. Pathological Morphology
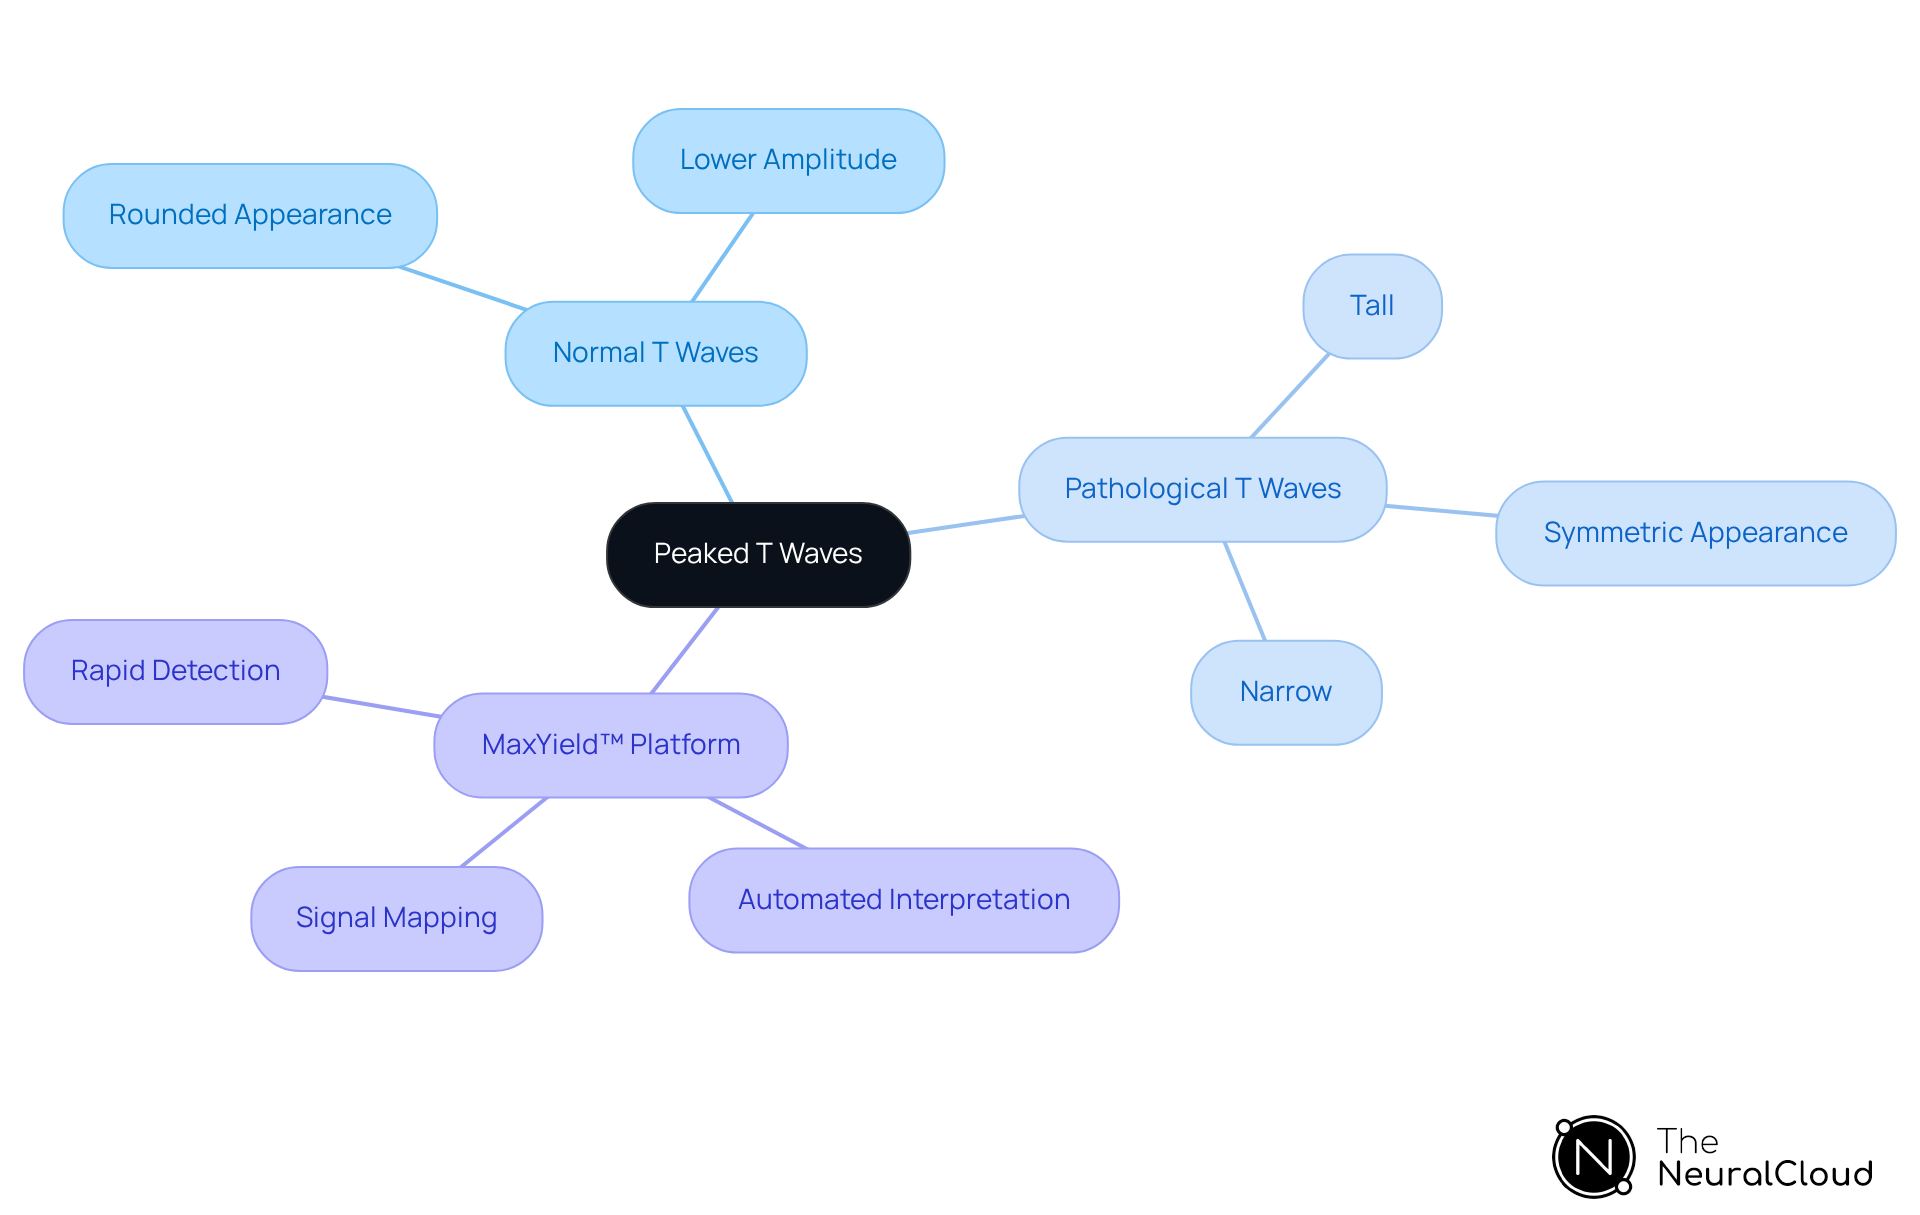
Peaked T wave forms are characterized by their tall, narrow, and symmetric appearance on an electrocardiogram (ECG). In contrast, normal T wave signals typically appear rounded and exhibit lower amplitude. Understanding the differences between normal and pathological T wave patterns is essential, as they often indicate underlying conditions. Clinicians must recognize that while peaked T waves can be a normal variant in some individuals, their presence alongside elevated serum potassium levels represents a significant clinical finding.
The technology addresses the challenges of ECG analysis by incorporating advanced algorithms. This system effectively maps ECG signals through noise, isolating and labeling key features in every heartbeat. It delivers beat-by-beat analysis of 200,000 heartbeats in less than 5 minutes, significantly enhancing the clarity of ECG readings. This capability facilitates timely interventions, enabling rapid detection of cardiac incidents.
Comprehending these distinctions is crucial for accurate diagnosis and subsequent patient care. The system improves clinical decision-making by providing thorough insights and addressing signal artifacts. By leveraging this technology, healthcare professionals can enhance diagnostic accuracy, leading to better patient outcomes. The integration of advanced tools not only streamlines the workflow but also empowers clinicians with the tools necessary for effective patient management.
Identify Key Characteristics of Peaked T Waves on ECG
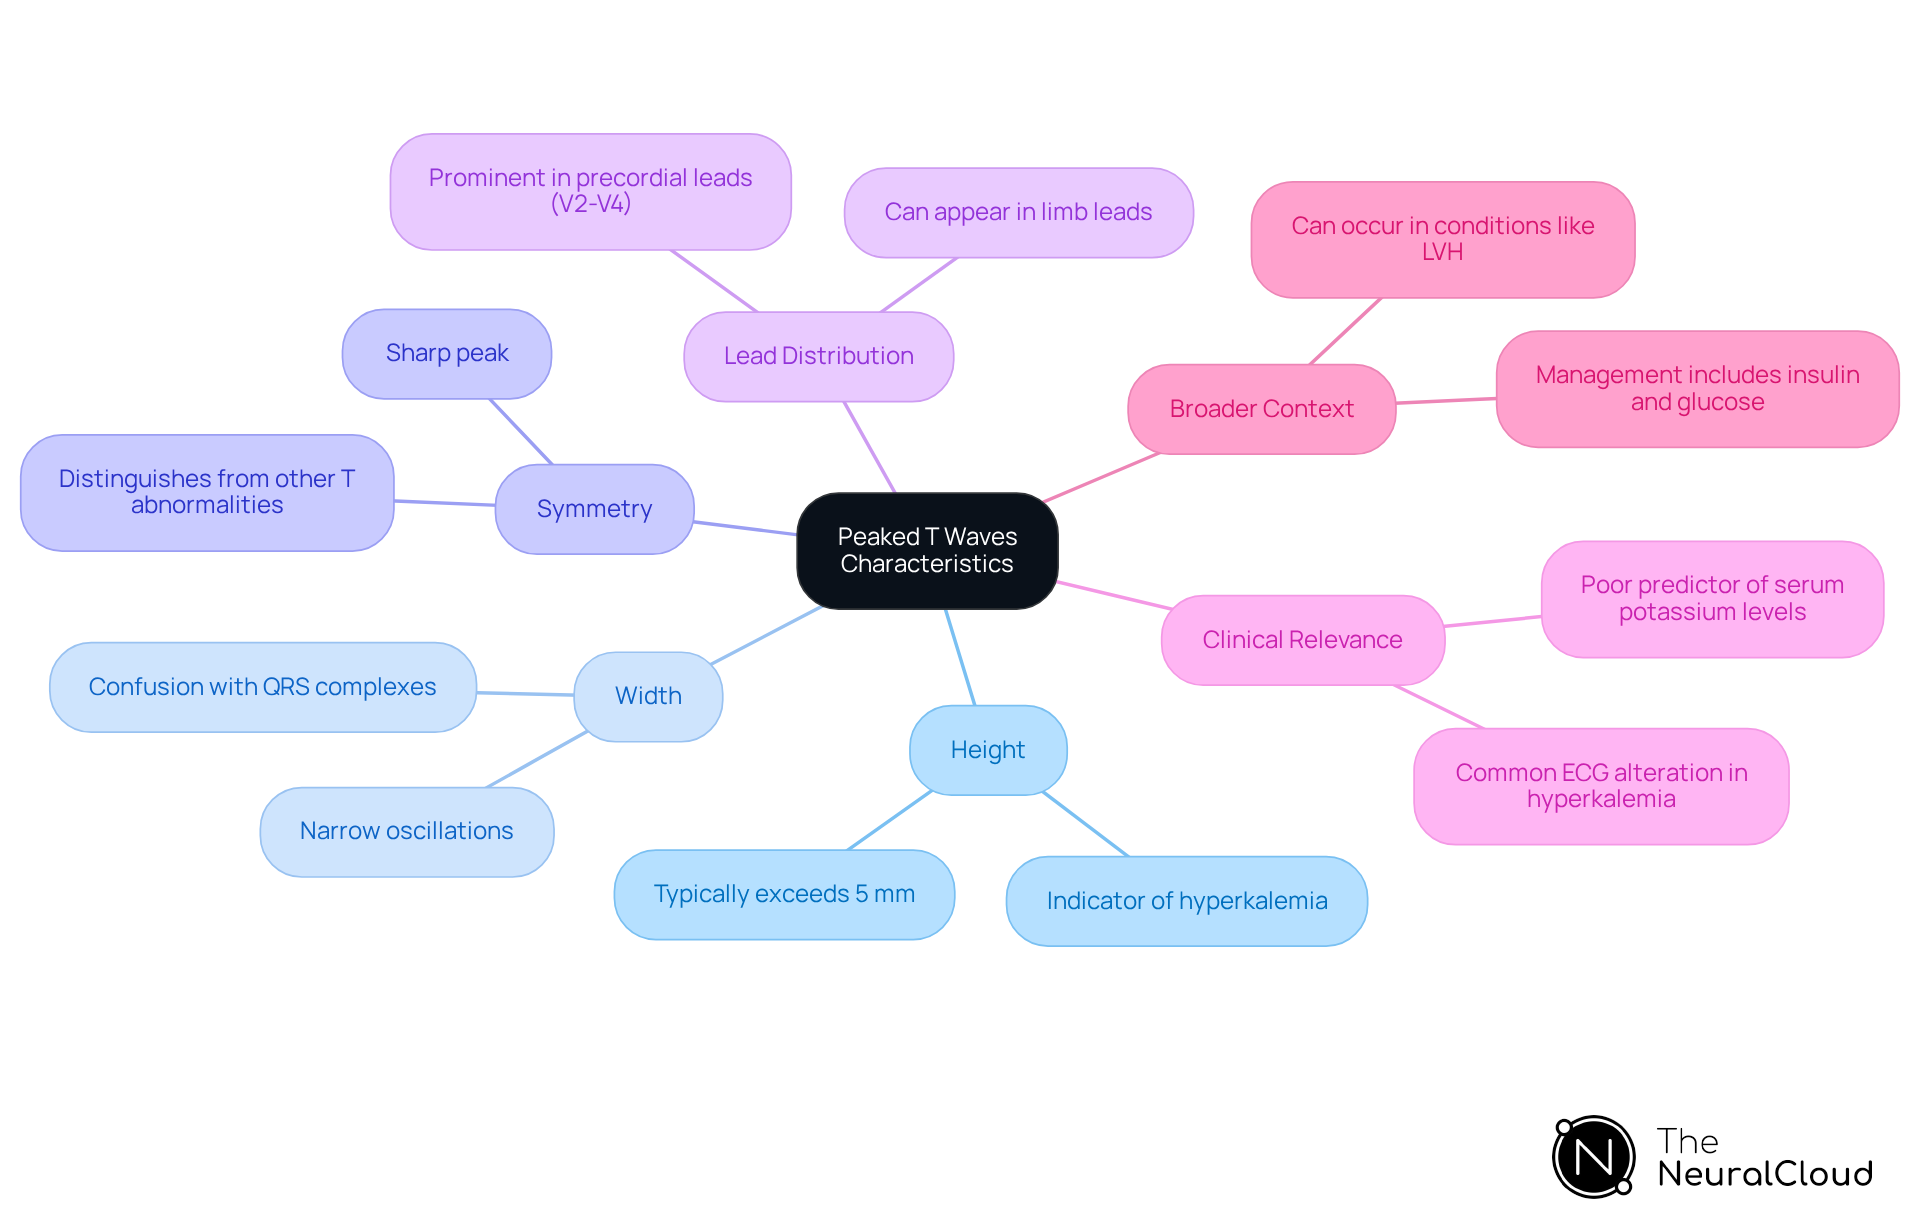
Key characteristics of peaked T waves include:
- Height: often exceeding 5 mm in amplitude. This height serves as a significant indicator of potential hyperkalemia. The technology enhances the identification of these waves by effectively filtering out noise and artifacts, ensuring accurate readings even in challenging conditions.
- Width: These oscillations are typically narrow, which can occasionally cause confusion with QRS complexes on the ECG. Careful differentiation during analysis is required. The software assist in distinguishing these waveforms, thereby improving diagnostic clarity.
- Symmetry: The shape of peaked T forms is generally symmetric, featuring a sharp peak that distinguishes them from other T wave abnormalities. This characteristic makes their identification crucial in diagnosing hyperkalemia. The continuous learning model of MaxYield™ evolves with each use, enhancing the accuracy of such identifications over time.
- Lead Distribution: in leads V2-V4 and can also appear in limb leads depending on the underlying condition. Recognizing these features is essential for accurate ECG interpretation and diagnosis of hyperkalemia, including cardiac arrhythmias, as their presence can indicate various underlying conditions that require further investigation. MaxYield™ assists in separating these signals from recordings with baseline drift and muscle artifacts, ensuring dependable analysis.
- Clinical Relevance: Peaked T waves are among the most common ECG alterations observed in hyperkalemic patients. However, they can also occur with elevated potassium in patients with acute kidney injury. This emphasizes the drawbacks of depending exclusively on T wave shape morphology for diagnosis. The system's ability to salvage obscured sections of lengthy recordings enhances the clinician's ability to make informed decisions based on comprehensive data.
- Broader Context: It is important to note that peaked T shapes can occur in conditions other than elevated potassium levels, such as early repolarization and left ventricular hypertrophy (LVH). Treatment, which may include therapies like insulin and glucose, is critical, as untreated hyperkalemia can lead to life-threatening complications such as ventricular fibrillation. Expert insights highlight the urgency of identifying patterns in clinical practice, as they act as an early warning indication that necessitates prompt medical attention. With the incorporation of the advanced system, healthcare providers can improve patient outcomes, ensuring timely and accurate interventions.
Explore Clinical Significance of Peaked T Waves in Hyperkalemia
Peaked T waves frequently serve as the initial ECG indication of hyperkalemia, typically appearing when serum potassium levels exceed 5.5 mEq/L. Their presence signifies altered cardiac repolarization, which can lead to serious complications such as arrhythmias.
The integration of Neural Cloud Solutions' technology addresses challenges in ECG analysis by evolving with each use to enhance diagnostic yield. This technology improves ECG analysis efficiency through advanced algorithms, swiftly separating ECG signals from recordings that may contain high levels of noise and artifact, ensuring accurate interpretation.
Clinicians must recognize that elevated potassium levels can lead to more severe ECG alterations, including the presence of QRS widening and absence of P wave patterns, as potassium levels rise. For instance, in cases of severe potassium overload, patients may exhibit a sine wave pattern on the ECG, indicating critical conditions that require prompt intervention.
Understanding the significance of hyperkalemia is vital, as it facilitates prompt treatment and may prevent life-threatening complications. Understanding the clinical implications, particularly with the support of diagnostic tools from MaxYield™, is essential for healthcare professionals managing patients with suspected elevated potassium levels, as timely identification can significantly influence patient outcomes.

Implement Diagnostic Strategies for Hyperkalemia: ECG and Laboratory Tests
To diagnose hyperkalemia effectively, clinicians should employ a combination of ECG and laboratory tests.
Clinicians should look for peaked T waves and other ECG changes, such as prolonged PR intervals and widened QRS complexes. These findings can indicate the seriousness of hyperkalemia. Utilizing Neural Cloud Solutions' platform enhances this analysis by providing advanced algorithms. This allows for quicker identification of abnormalities while reducing operational costs associated with manual data handling. The platform's advanced noise filtering and signal clarity features further improve the accuracy of ECG readings.
Laboratory Tests: Confirm hyperkalemia through serum potassium level measurements. A potassium level exceeding 5.5 mEq/L suggests hyperkalemia. Additional tests may include renal function tests and electrolyte panels to assess the underlying cause.
Clinical Correlation: Always correlate ECG findings with the patient's clinical presentation and history. Symptoms such as muscle weakness, palpitations, or changes in mental status can provide context for the ECG findings. The platform's automated annotations assist clinicians in focusing on these essential correlations without being hindered by inefficiencies in data processing.
Continuous Monitoring: In situations of suspected hyperkalemia, continuous ECG monitoring is advised to identify any progression of arrhythmias or other complications. The advanced capabilities of the platform support this need by ensuring clean signal analysis, which is crucial for accurate monitoring and timely management of patients. Additionally, the integration of technology with the platform allows for real-time data collection and analysis, further enhancing patient care.
Conclusion
Peaked T waves serve as a critical indicator of hyperkalemia, reflecting a significant shift in cardiac repolarization that can lead to serious complications if not addressed promptly. Understanding the distinct characteristics of these waves—such as their height, width, and symmetry—enables healthcare professionals to make informed decisions regarding patient management. The MaxYield™ platform plays a paramount role in enhancing the clarity and accuracy of ECG interpretations, thereby improving diagnostic capabilities.
This tutorial has explored the key features of peaked T waves and their clinical significance in hyperkalemia. It emphasized the importance of integrating ECG analysis with laboratory tests for effective diagnosis. Peaked T waves can act as an early warning sign, necessitating timely intervention to prevent life-threatening conditions. Additionally, the discussion on the MaxYield™ platform highlights the value of automation and advanced analytics in modern clinical practice, ensuring healthcare providers can swiftly identify and respond to critical changes in patient status.
In conclusion, recognizing peaked T waves in hyperkalemia is not just an academic exercise; it is a vital skill that can significantly impact patient outcomes. As technology evolves, embracing tools that enhance ECG analysis will empower clinicians to deliver timely and effective care. The integration of advanced diagnostic strategies is essential for improving hyperkalemia management, ultimately leading to better patient health and safety.
Frequently Asked Questions
What are peaked T waves and how do they differ from normal T waves?
Peaked T waves are characterized by their tall, narrow, and symmetric appearance on an electrocardiogram (ECG), whereas normal T waves typically appear rounded and exhibit lower amplitude.
Why is it important to differentiate between normal and pathological T wave patterns?
Differentiating between normal and pathological T wave patterns is essential because peaked T waves, particularly in the context of hyperkalemia, may indicate underlying medical conditions. Their presence alongside elevated serum potassium levels is a significant clinical finding.
How does the MaxYield™ platform assist in ECG analysis?
The MaxYield™ platform aids ECG analysis by utilizing advanced technology for automated ECG interpretation. It effectively maps ECG signals through noise, isolating and labeling key features in each heartbeat, and provides beat-by-beat analysis of 200,000 heartbeats in less than 5 minutes.
What benefits does the MaxYield™ platform offer for detecting peaked T waves?
The MaxYield™ platform enhances the clarity of ECG readings, facilitating precise analysis of peaked T waves associated with hyperkalemia, and enabling rapid detection of cardiac incidents.
How does automated ECG analysis improve clinical decision-making?
Automated ECG analysis improves clinical decision-making by providing thorough insights and addressing signal artifacts, which enhances healthcare professionals' diagnostic capabilities and leads to better patient outcomes.
What impact does the integration of automated ECG analysis have on healthcare workflow?
The integration of automated ECG analysis streamlines the workflow for healthcare professionals, empowering them with the necessary tools for effective patient management and improving overall efficiency in clinical settings.
List of Sources
- Identify Key Characteristics of Peaked T Waves on ECG
- droracle.ai (https://droracle.ai/articles/28639/peaked-t-wave-definition)
- droracle.ai (https://droracle.ai/articles/76280/what-causes-peaked-t-waves-on-ecg)
- acadoodle.com (https://acadoodle.com/articles/5-ecg-changes-of-hyperkalemia-you-need-to-know)
- Explore Clinical Significance of Peaked T Waves in Hyperkalemia
- Why T Waves Peak in Hyperkalemia (https://ecglectures.com/blog/peaked-t-waves-in-hyperkalemia)
- Hyperkalaemia (https://litfl.com/hyperkalaemia-ecg-library)
- Hyperkalemia ECG Changes: Peaked T Waves (https://powerfulmedical.com/blog/hyperkalemia-ecg-critical-changes)
- droracle.ai (https://droracle.ai/articles/298655/peak-t-wave-mean)