Introduction
ECG interpretation presents significant challenges, especially in identifying STEMI equivalents that can greatly influence patient outcomes. For health tech developers, understanding these critical markers is essential for enhancing diagnostic accuracy and improving clinical workflows. As cardiac diagnostics change, it's important to ask: how can developers use advanced technologies to better recognize and differentiate these important ECG patterns? This article explores ten essential STEMI equivalents, providing insights that can empower clinicians and researchers alike in their quest for precision in cardiac care.
Neural Cloud Solutions: MaxYield™ for Enhanced ECG Analysis
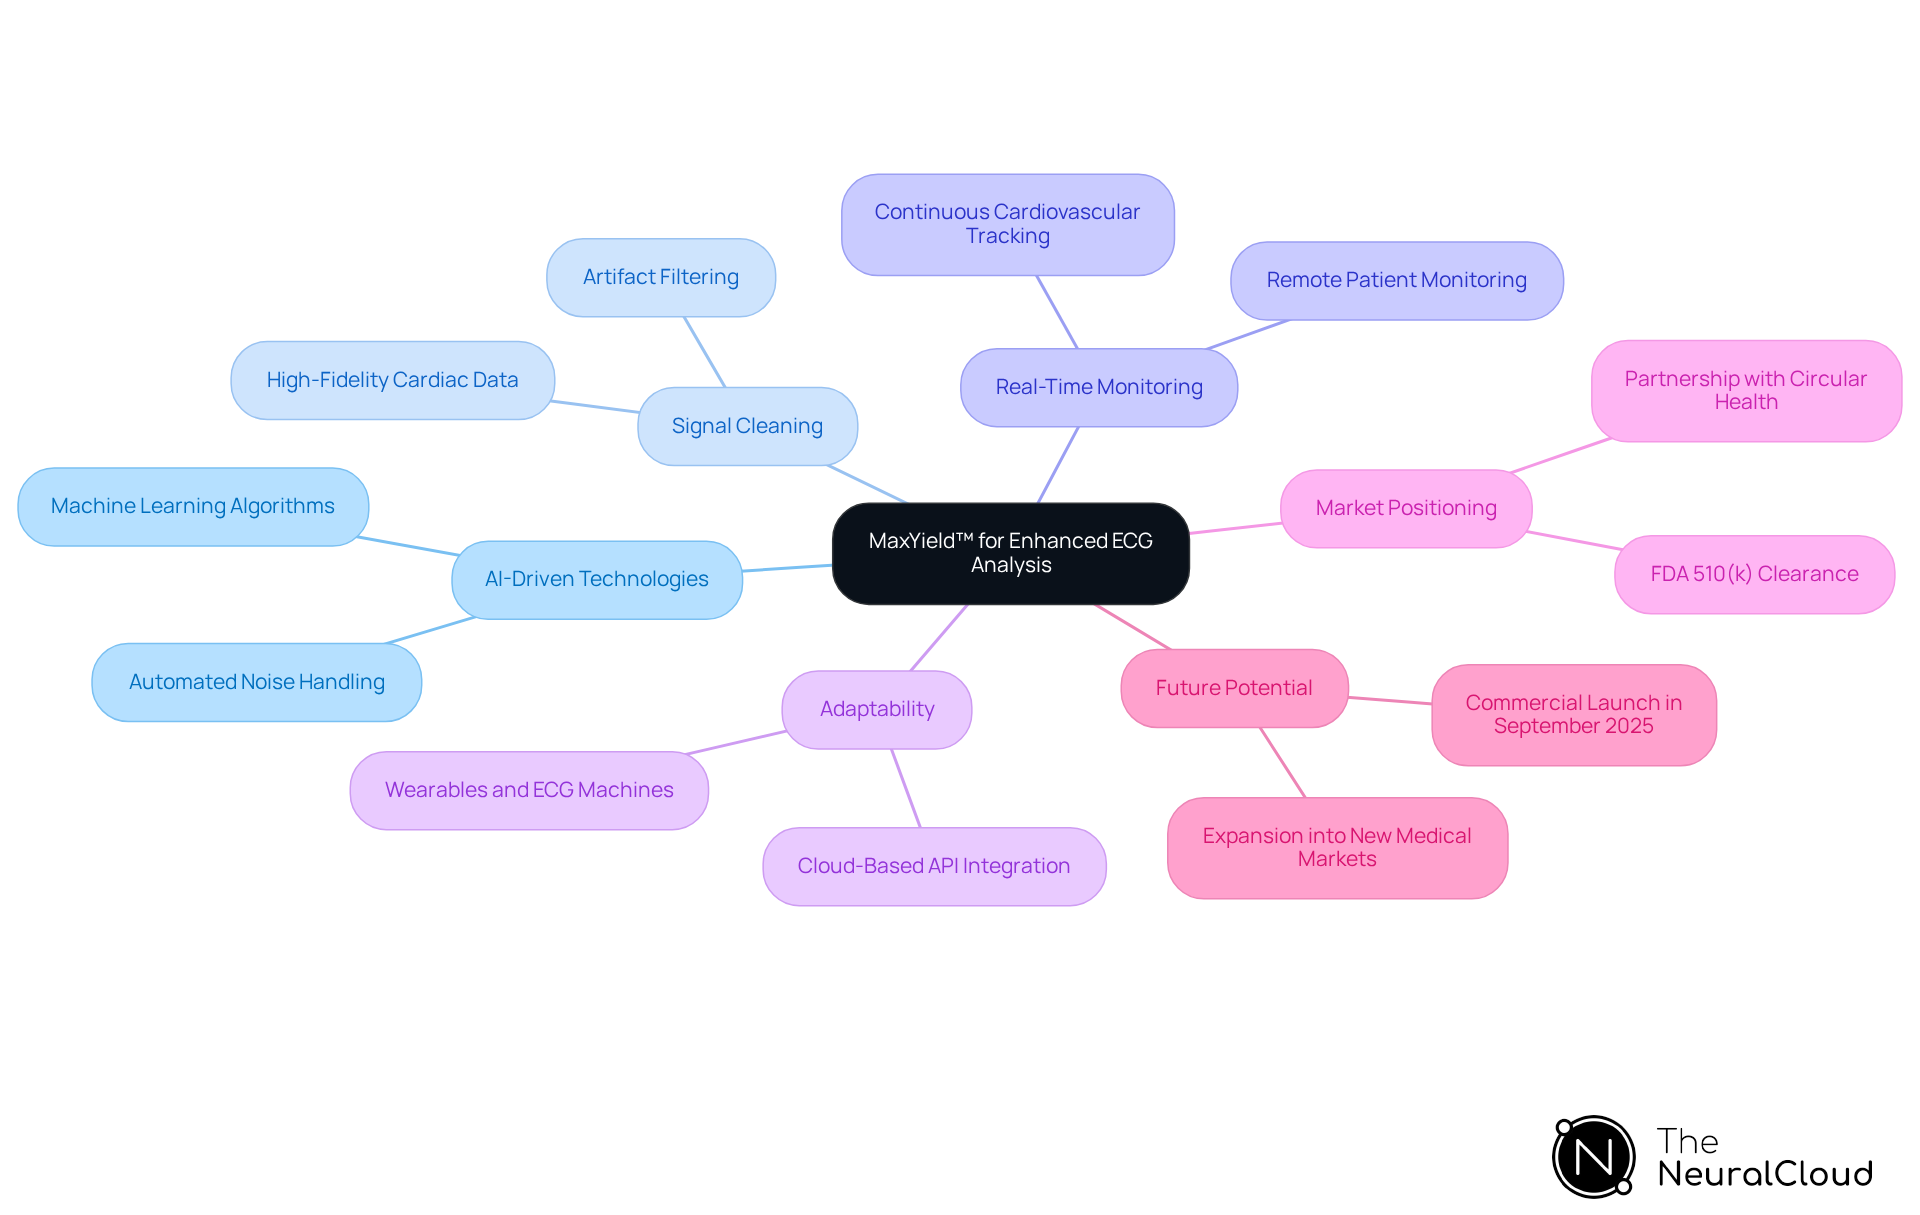
Healthcare professionals often struggle with noisy ECG signals that hinder accurate diagnostics. Neural Cloud Solutions' innovative platform revolutionizes ECG analysis through advanced AI-driven technologies. By effectively isolating and cleaning these noisy signals, the system delivers high-fidelity cardiac data crucial for accurate diagnostics. This intelligence layer works well with existing ECG workflows, transforming raw recordings into structured data that medical professionals can easily interpret. The platform's patented signal mapping algorithms ensure clinicians receive precise, actionable insights, significantly enhancing the speed and accuracy of ECG data analysis.
The product not only enhances the quality of ECG signals but also facilitates real-time monitoring of cardiovascular metrics. This capability helps healthcare providers manage cardiovascular risks more effectively. As a result, unnecessary hospital visits are reduced. The incorporation of this technology into different devices, such as wearables and conventional ECG machines, illustrates its adaptability and dedication to improving health outcomes.
Recent advancements in AI-driven ECG analysis have positioned the company as a leader in the field, particularly in Canada, where the demand for high-quality ECG signal processing is rapidly growing. The platform's ability to provide cleaner signals and more reliable insights is validated by expert opinions, emphasizing its role in improving clinical decision-making and patient engagement. As Esmat Naikyar, President of Neural Cloud Solutions, stated, "By enabling platforms like this to leverage our signal-processing technology, we can ensure that the data powering those insights is as accurate and reliable as possible." Furthermore, the collaboration with Circular Health to incorporate the innovative technology into their smart ring device highlights the platform's market positioning and future potential, with a commercial launch targeted for September 2025. As the healthcare landscape evolves towards continuous remote monitoring, this solution stands out as a vital tool for clinicians aiming to deliver the best possible care, overcoming signal artifacts and enhancing workflow efficiency. Additionally, MaxYield™ offers premium subscription opportunities that provide unique metrics, further enhancing its value proposition in the market.
Sgarbossa's Criteria: Identifying Myocardial Infarctions in Bundle Branch Blocks
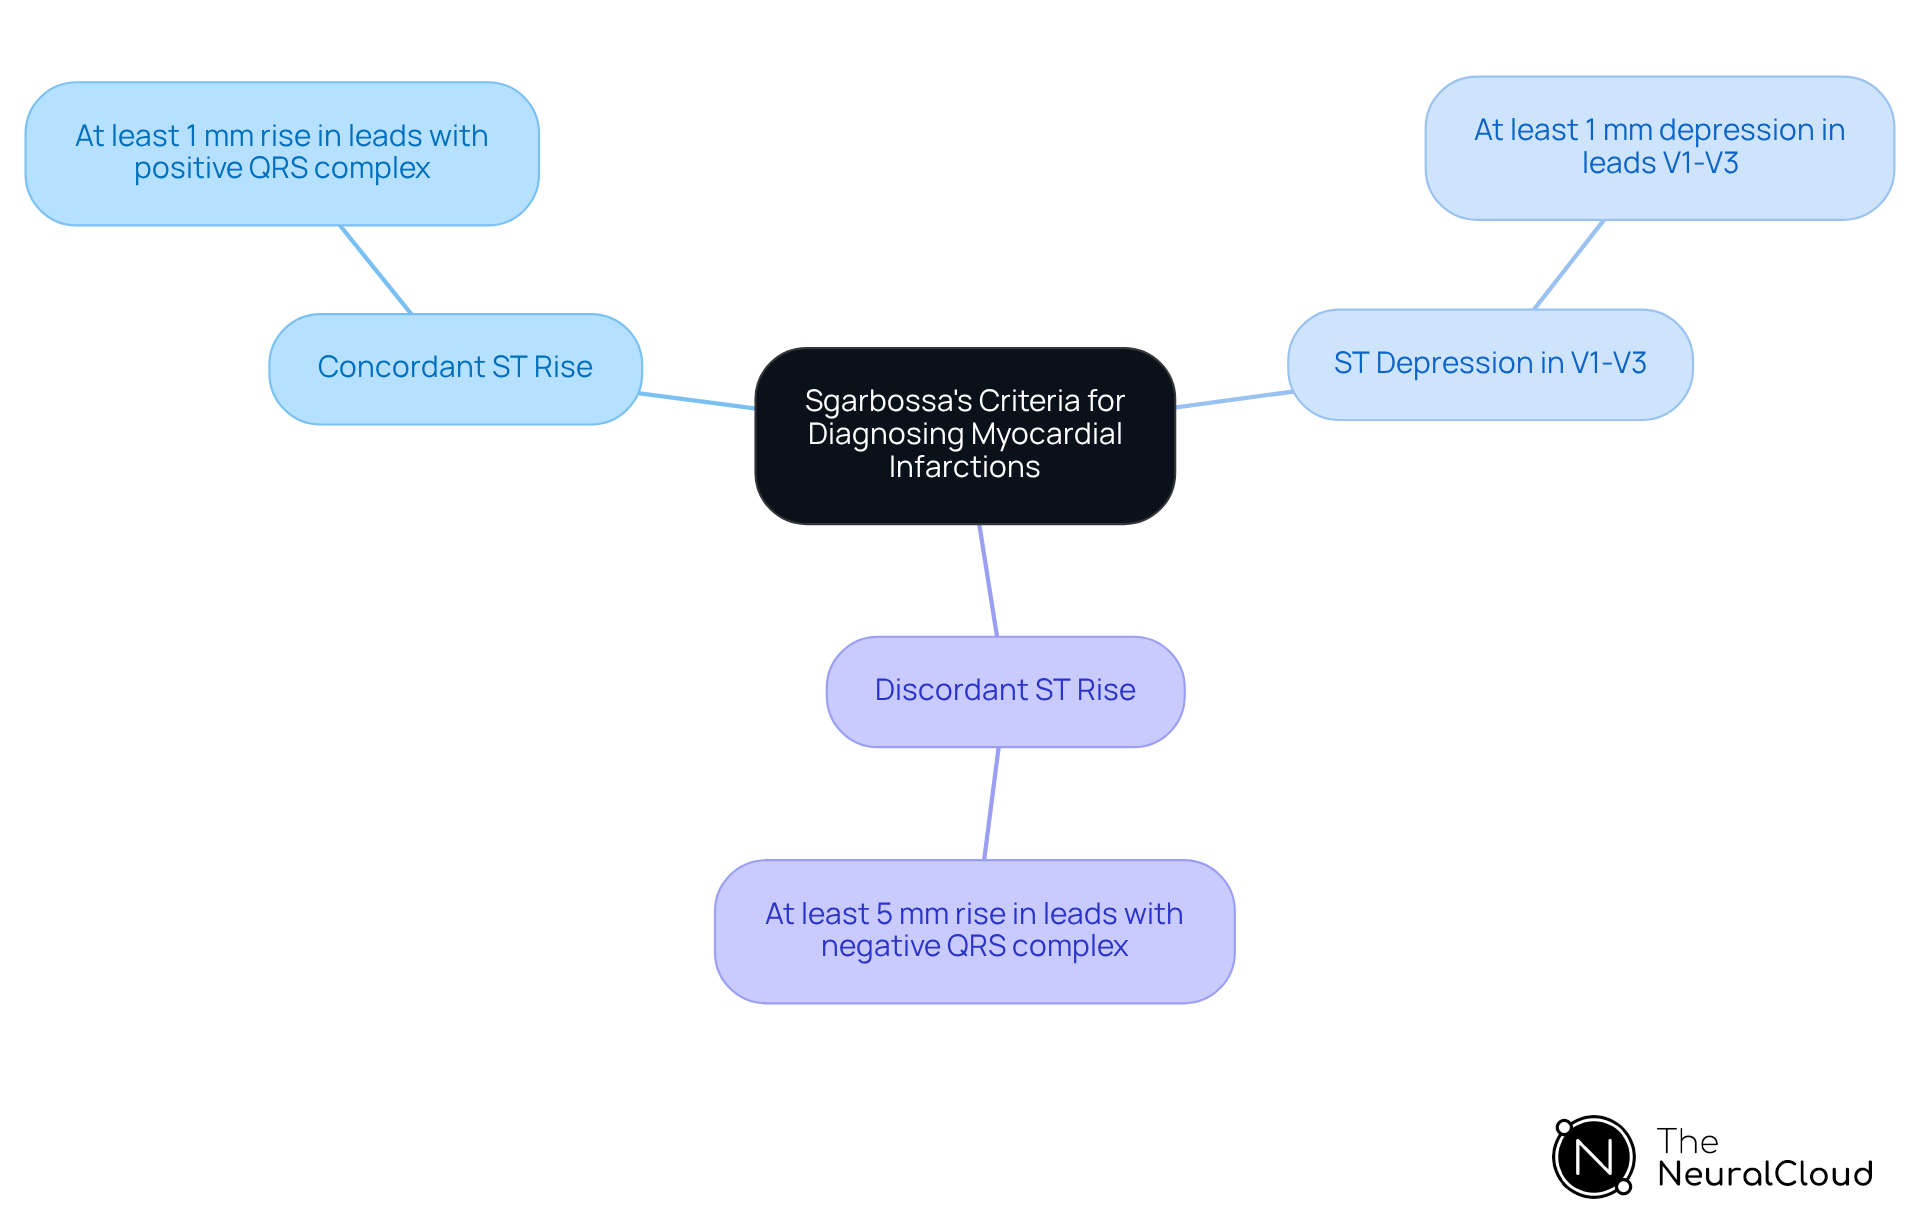
Diagnosing myocardial infarctions in patients with left bundle branch block (LBBB) poses unique challenges that require precise criteria for accurate assessment. Sgarbossa's Criteria are essential for diagnosing these conditions and consist of three key components:
- Concordant ST rise of at least 1 mm in leads with a positive QRS complex
- ST depression of at least 1 mm in leads V1-V3
- Discordant ST rise of at least 5 mm in leads with a negative QRS complex
These criteria help clinicians identify acute coronary occlusion, even without typical ST elevation, by utilizing stemi equivalents ECG. This capability is crucial for timely intervention.
Recent studies show that applying Sgarbossa's Criteria has significantly improved diagnostic accuracy, with sensitivity rates reaching as high as 93% to 94%. This improvement not only enhances patient outcomes but also streamlines emergency protocols, reducing the number of patients unnecessarily subjected to emergent reperfusion treatments.
As the medical community refines diagnostic tools, Sgarbossa's Criteria remain a cornerstone for assessing myocardial infarctions, especially in complex LBBB cases, in conjunction with stemi equivalents ECG. Neural Cloud Solutions' MaxYield™ platform enhances this process by effectively filtering noise and recognizing distinct ECG waves, even in recordings with significant artifacts. This advanced capability allows for the salvage of previously obscured sections of lengthy Holter, 1-Lead, and patch monitor recordings, ultimately improving diagnostic yield and accuracy.
Additionally, the customizable visualization and reporting tool, Insight360, transforms MaxYield’s clean ECG data into interactive dashboards and clinical-ready reports. This transformation further enhances the clinician's ability to interpret complex data.
De Winter's T-Waves: Recognizing Proximal LAD Occlusion Without ST Elevation
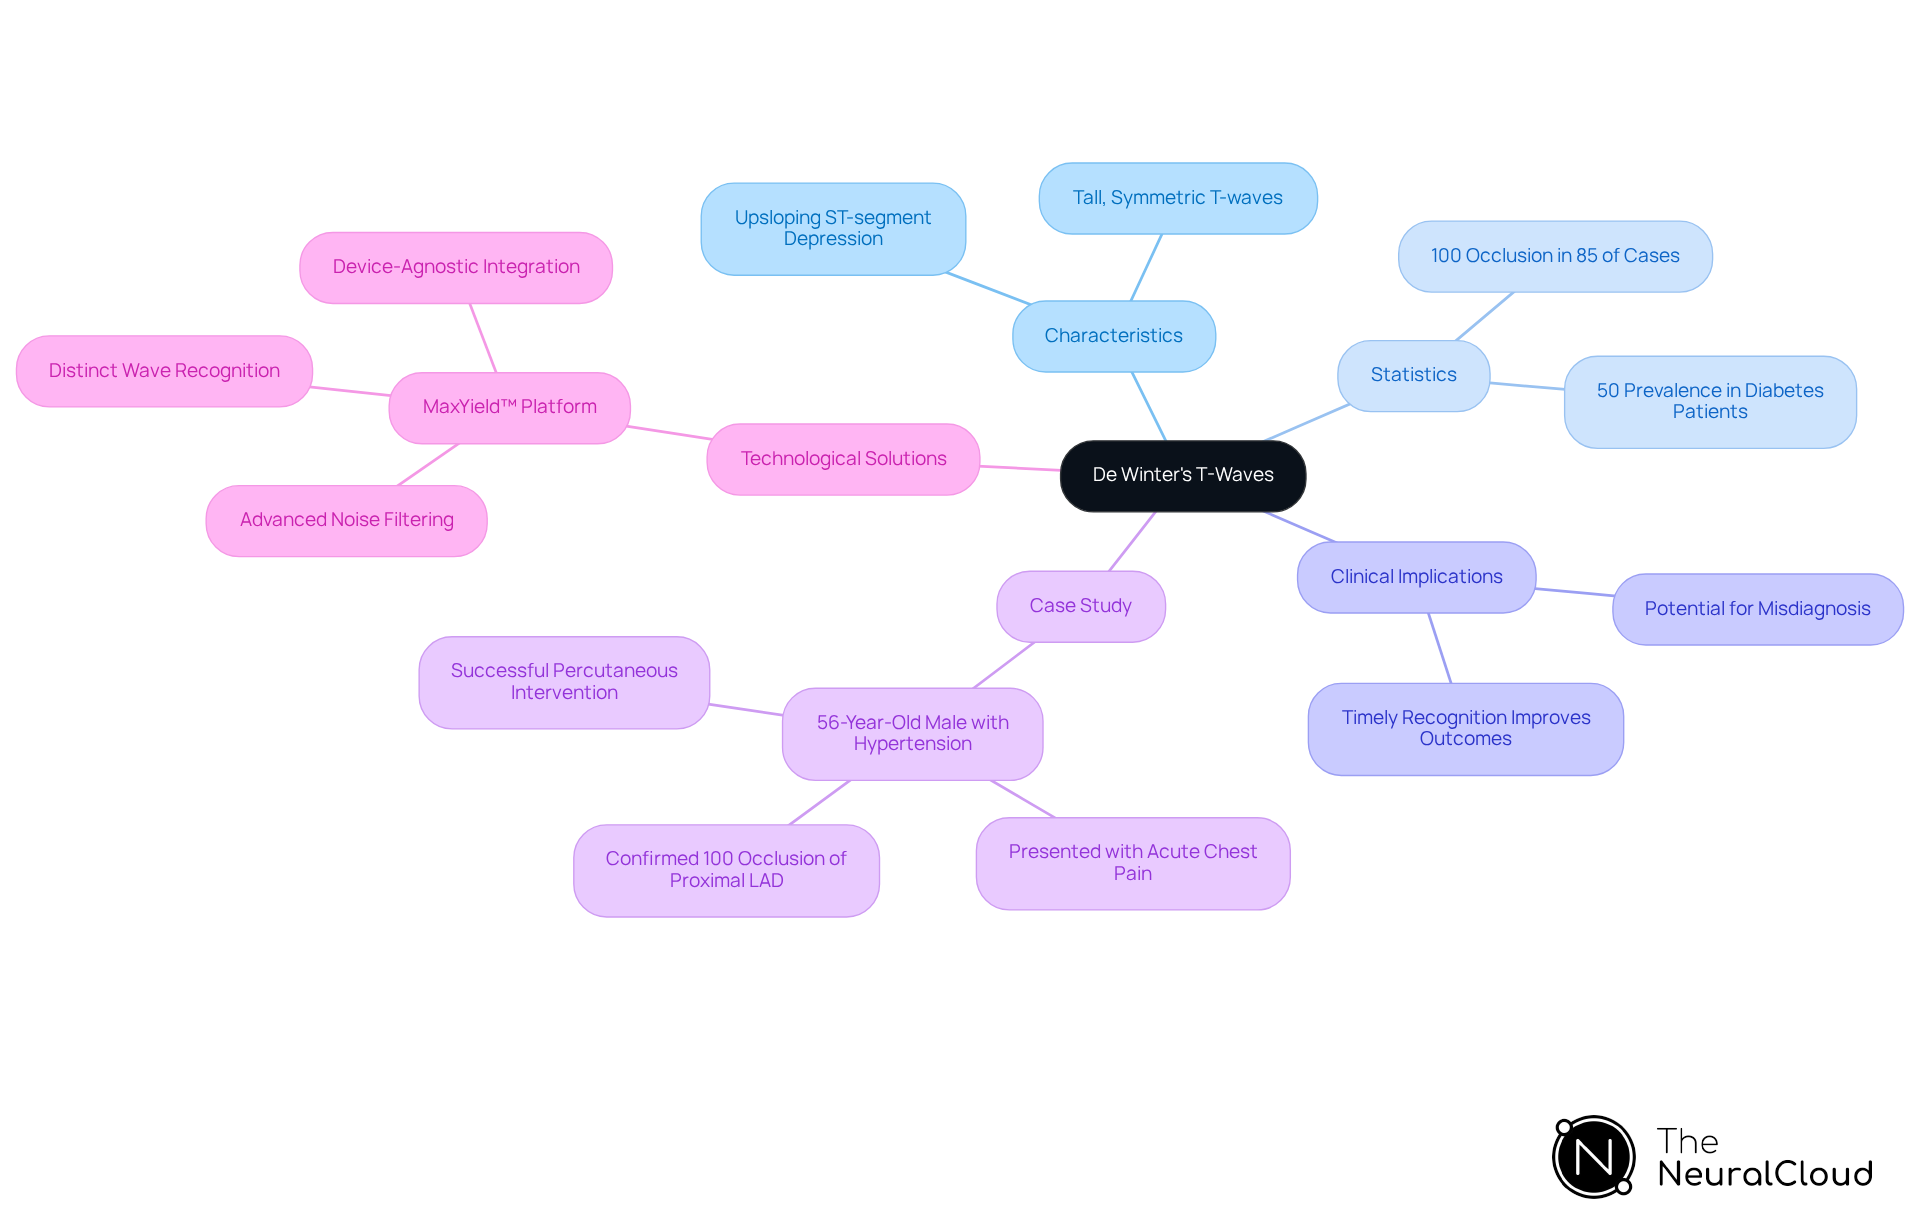
De Winter's T-waves present a unique challenge in ECG analysis, often leading to critical misdiagnoses. They are characterized by upsloping ST-segment depression followed by tall, symmetric T-waves, typically observed in leads V2-V3. This pattern can lead to misdiagnosis if not recognized, complicating timely treatment, as it suggests proximal left anterior descending (LAD) artery blockage and can appear without the typical ST rise usually linked to acute myocardial infarction (AMI). Recognizing this pattern is vital for quick diagnosis and intervention, signaling a critical condition that needs immediate attention.
Statistically, the de Winter T-wave pattern correlates with a 100% occlusion of the proximal LAD in approximately 85% of cases. This highlights how crucial it is for emergency physicians to stay alert for atypical ECG findings, not just the usual ST-segment elevations. A recent case study illustrated this point with a 56-year-old male who had a history of hypertension and presented with acute chest pain. His initial ECG revealed hyperacute T-waves and ST-segment depression, leading to emergent cardiac catheterization that confirmed a 100% occlusion of the proximal LAD. Following successful percutaneous intervention, the individual experienced no further complications, emphasizing the life-saving potential of recognizing De Winter's T-waves.
Expert opinions stress that timely recognition of this ECG pattern can significantly improve patient outcomes. The clinical implications are significant, as misclassification or delays in treatment can adversely affect outcomes for individuals. Additionally, the prevalence of diabetes mellitus in patients presenting with the de Winter T-wave pattern is noteworthy, with studies indicating a 50% prevalence in this group.
The MaxYield™ platform addresses the challenges of ECG analysis by employing advanced noise filtering and distinct wave recognition capabilities. This device-agnostic ECG intelligence layer integrates seamlessly via API, SDK, or CDK, enhancing the accuracy of ECG interpretations even in the presence of noise and artifacts. MaxYield™ also salvages previously obscured sections of lengthy Holter, 1-Lead, and patch monitor recordings, evolving with each use to maximize diagnostic yield. As the medical community continues to evolve in its understanding of atypical ECG patterns, the de Winter T-wave pattern stands out as a critical marker for acute anterior ischemia, reinforcing the need for ongoing education and awareness in emergency settings. As awareness of this pattern grows, so too does the potential for improved patient outcomes in emergency care.
Wellens' Syndrome: A Key Indicator of Critical Coronary Artery Disease
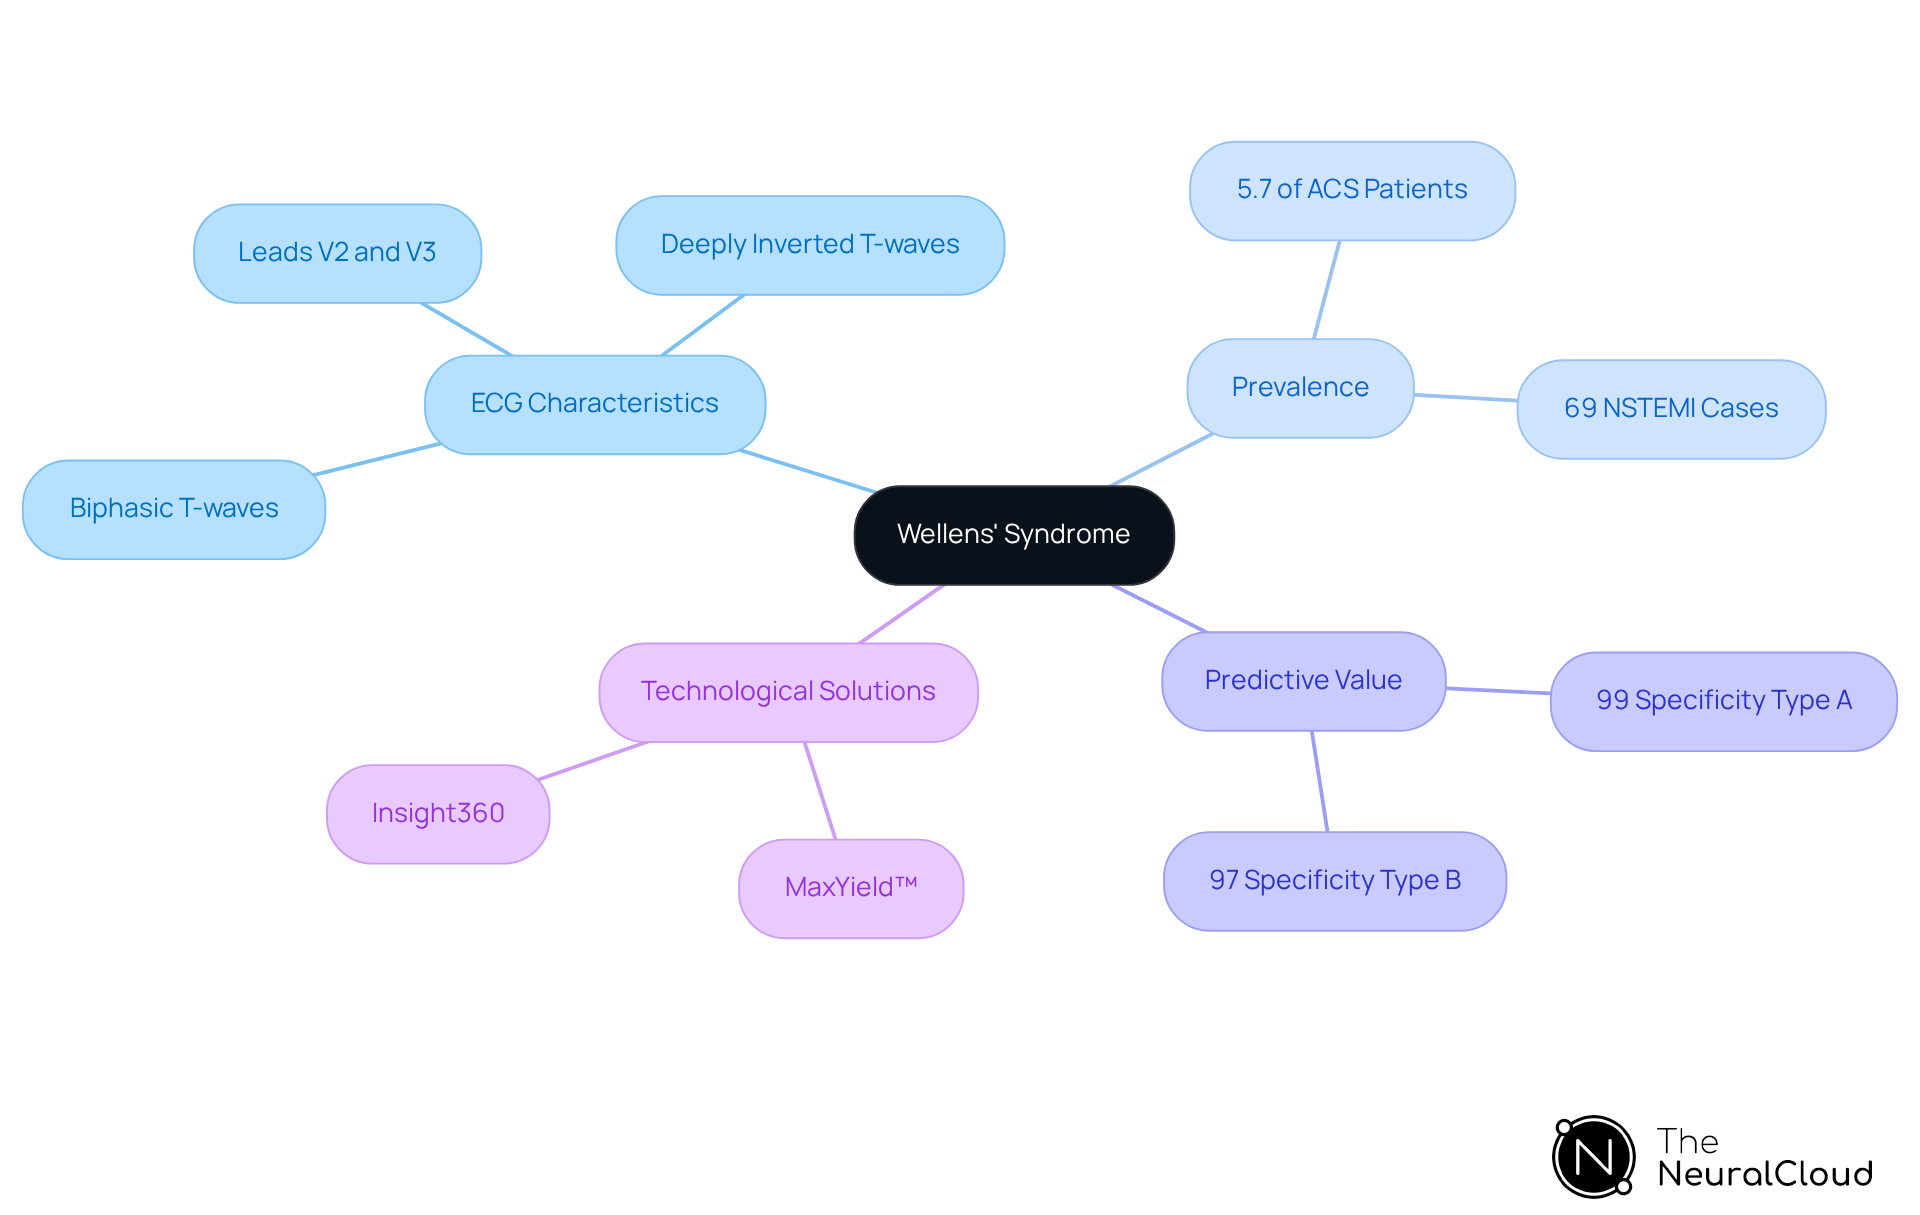
Wellens' Syndrome presents unique challenges in ECG analysis, marked by specific T-wave abnormalities that signal critical cardiac conditions. Characterized by biphasic or deeply inverted T-waves in leads V2 and V3, this syndrome typically follows a recent history of resolved chest pain. This unique pattern indicates a serious narrowing of the proximal left anterior descending (LAD) artery, acting as a vital warning for potential heart attacks, which can be detected using stemi equivalents ECG. The syndrome occurs in about 5.7% of individuals with acute coronary syndrome (ACS), with a significant 69% presenting as non-ST elevation myocardial infarction (NSTEMI).
It's crucial for healthcare providers to recognize Wellens' Syndrome, as it requires prompt intervention. Often, patients need immediate cardiac catheterization to avert serious complications. The predictive value of Wellens' Syndrome for myocardial infarction is underscored by its high specificity of 99% for Type A and 97% for Type B patterns, highlighting its importance in cardiac diagnostics, especially concerning stemi equivalents ECG.
With Neural Cloud Solutions' platform, healthcare professionals can enhance their ability to identify such critical conditions. MaxYield™ uses cutting-edge noise filtering and precise wave recognition to extract ECG waves, even from recordings affected by baseline wander, movement, and muscle noise. This capability ensures that previously obscured sections of lengthy Holter, 1-Lead, and patch monitor recordings can be salvaged, thereby improving diagnostic accuracy and efficiency in recognizing conditions like Wellens' Syndrome.
Additionally, the Insight360 tool transforms MaxYield’s clean ECG data into interactive dashboards and clinical-ready reports, further supporting healthcare providers in their diagnostic efforts.
Posterior Myocardial Infarction: Uncovering the Concealed Threat
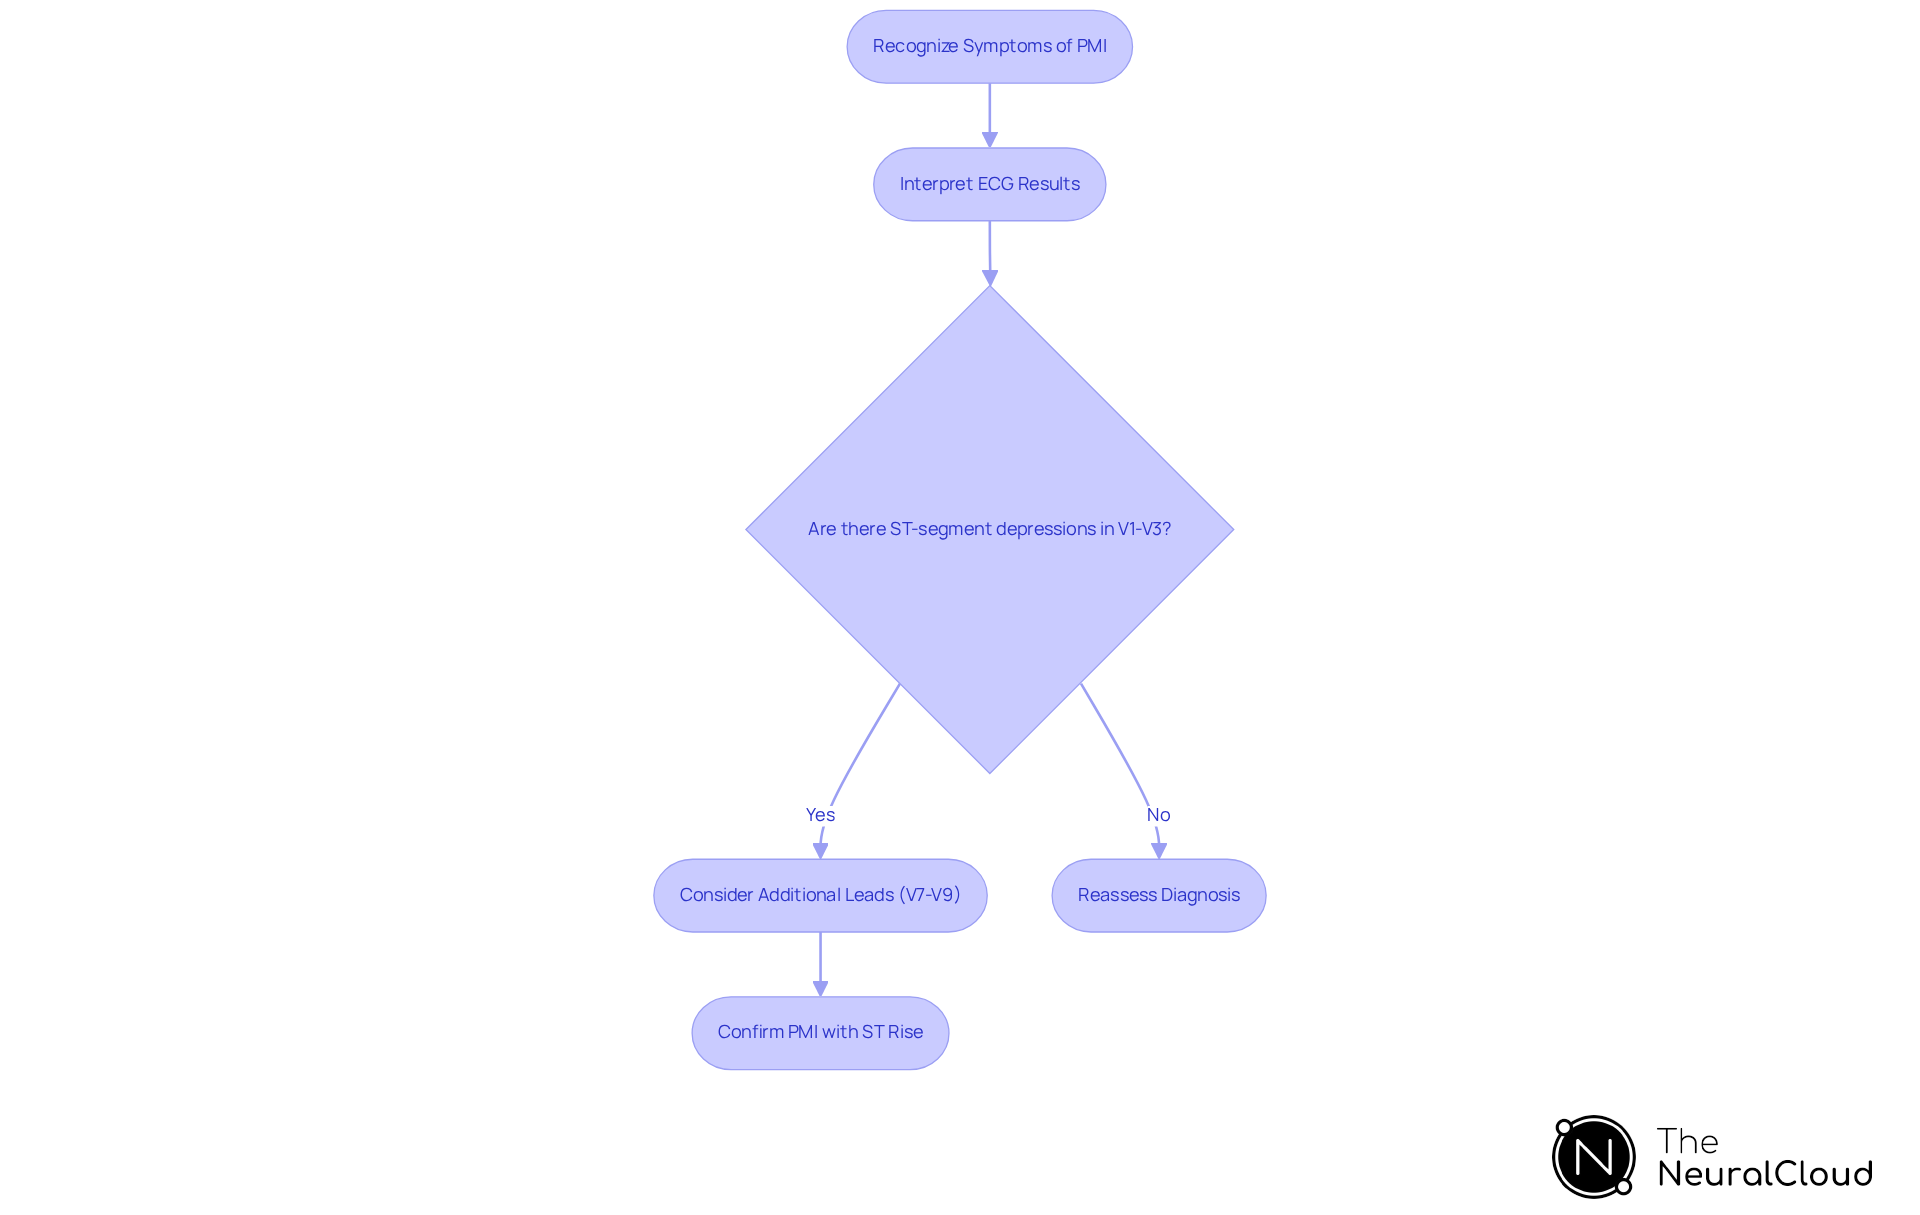
Diagnosing posterior myocardial infarction (PMI) presents unique challenges for healthcare professionals, often leading to misinterpretation of ECG results. PMI can manifest atypically, frequently showing ST-segment depression in the anterior leads (V1-V3) and tall R-waves in these leads.
To confirm PMI, additional posterior leads (V7-V9) may be utilized to detect ST rise. Diagnosing PMI can be particularly difficult due to its non-standard symptoms, which often lead to misinterpretation of ECG results.
It's crucial to recognize these signs because PMI represents 15-21% of all myocardial infarctions, and missing it can lead to serious health issues. Timely recognition of PMI is essential to prevent serious complications and improve patient outcomes.
Isolated ST Elevation in aVR: Marking Global Ischemic Risk
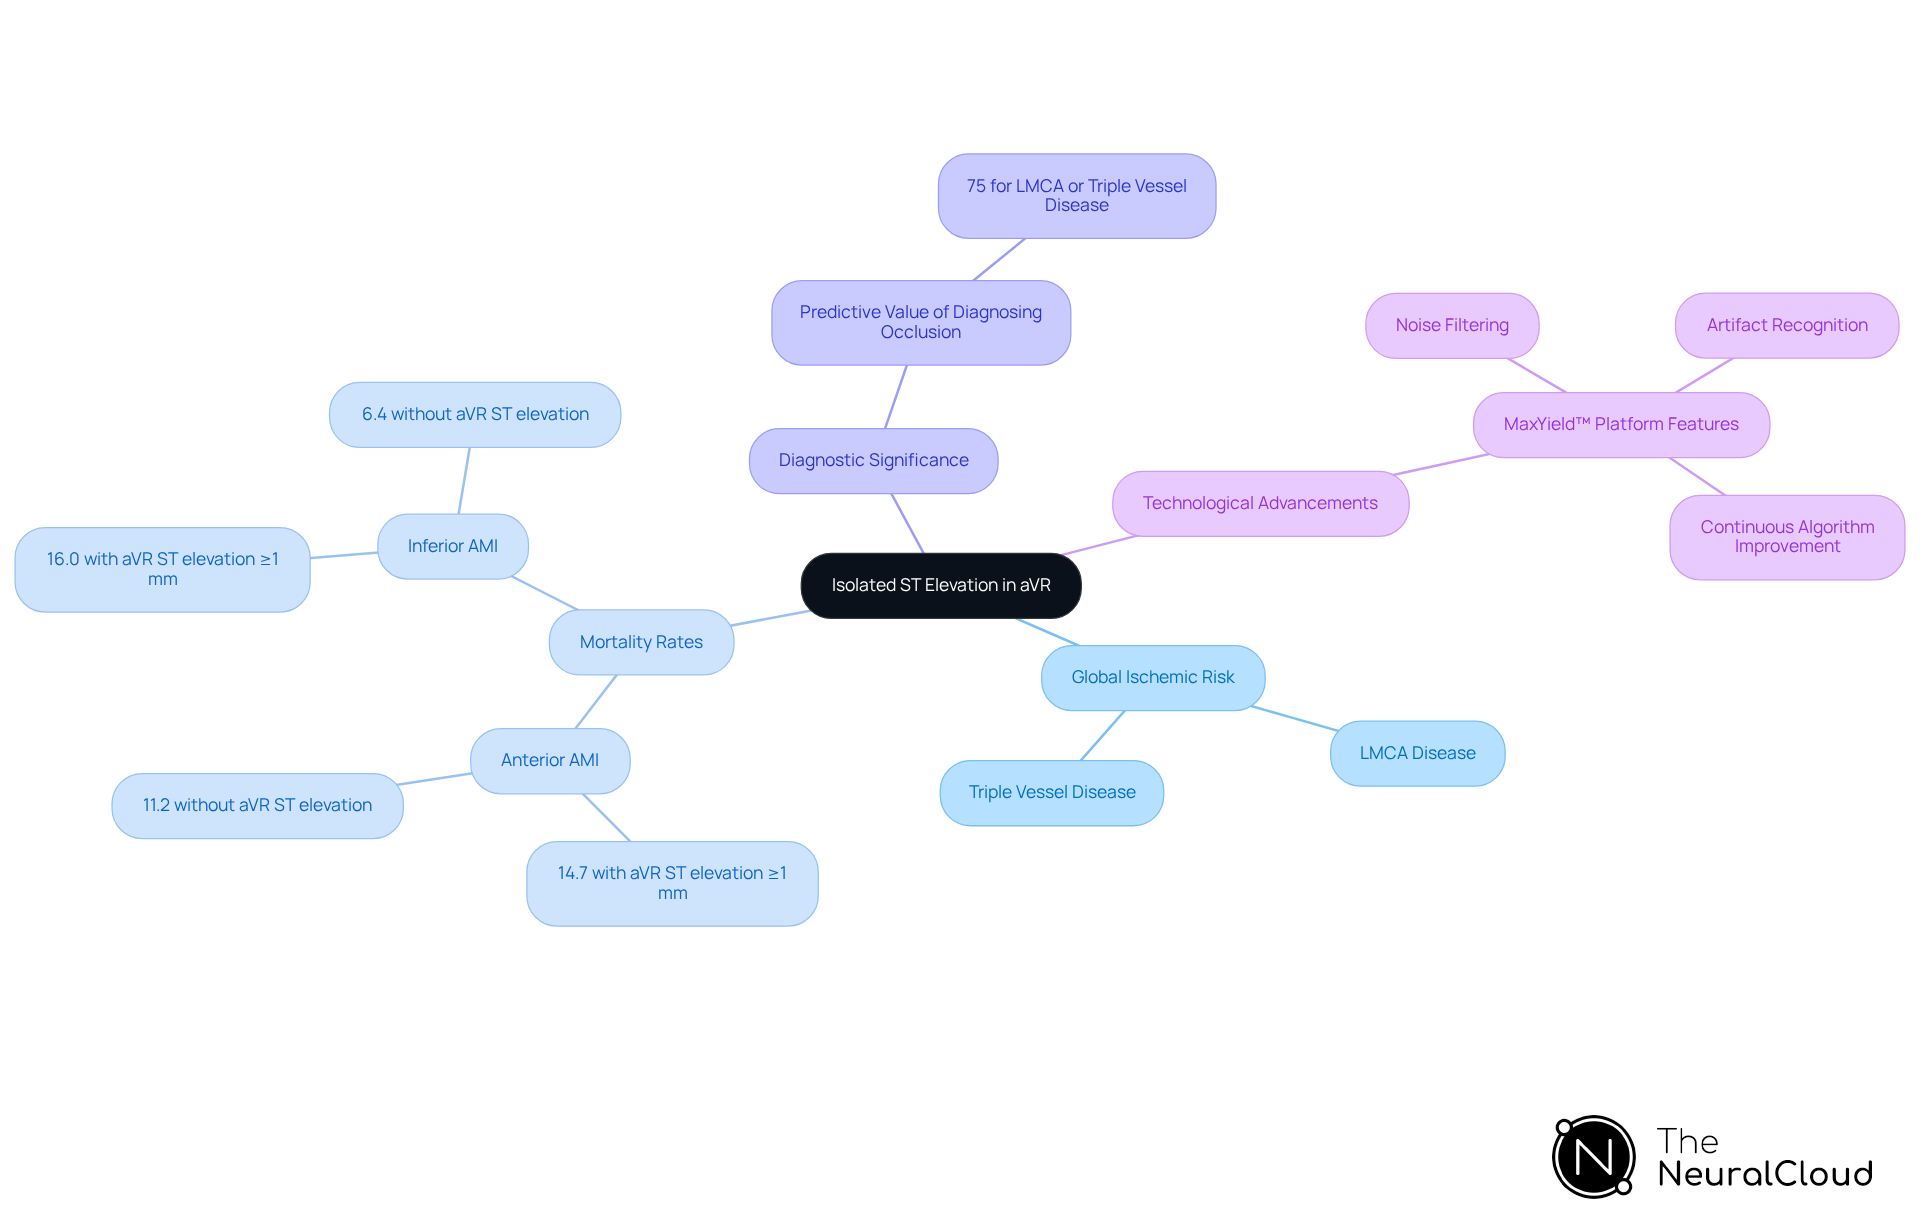
The isolated ST rise in lead aVR, often seen alongside widespread ST-segment depression, presents a significant challenge in the analysis of stemi equivalents ECG. This pattern may indicate severe left main coronary artery (LMCA) or triple vessel disease, which can be identified using stemi equivalents ECG, signaling global ischemia that requires immediate evaluation and intervention. Recent studies show that aVR ST rise of ≥1 mm correlates with a significantly higher 30-day mortality rate in individuals with normal intraventricular conduction, reinforcing its role as a negative prognostic indicator in acute myocardial infarction (AMI), which is relevant for understanding stemi equivalents ECG. For example, in cases of anterior AMI, the mortality rate was 14.7% with aVR ST elevation compared to 11.2% without it. Similarly, for inferior AMI, the rates were 16.0% versus 6.4%. Identifying this sign is crucial for healthcare providers in the context of stemi equivalents ECG. Timely intervention can lead to improved patient outcomes, especially in cases involving stemi equivalents ECG.
The MaxYield™ platform from Neural Cloud Solutions enhances the interpretation of such critical ECG findings. It effectively filters noise and recognizes distinct waveforms, even in recordings with significant artifacts. This feature helps recover important data from lengthy Holter, 1-Lead, and patch monitor recordings, ensuring that healthcare professionals can make informed decisions based on accurate data. Additionally, the algorithm evolves with each use, continuously improving its accuracy and efficiency.
Case studies illustrate that patients exhibiting stemi equivalents ECG often present with extensive ST depression across multiple leads, indicating a higher degree of myocardial ischemia and a greater likelihood of serious coronary artery conditions. The predictive value of diagnosing occlusion in the left main coronary artery or triple-vessel disease, as indicated by stemi equivalents ECG, is noted to be 75%. Thus, leveraging advanced technologies like MaxYield™ can transform cardiac care and enhance patient outcomes in critical situations, particularly in the detection of stemi equivalents ECG.
Hyperacute T-Waves: Early Indicators of Ischemia
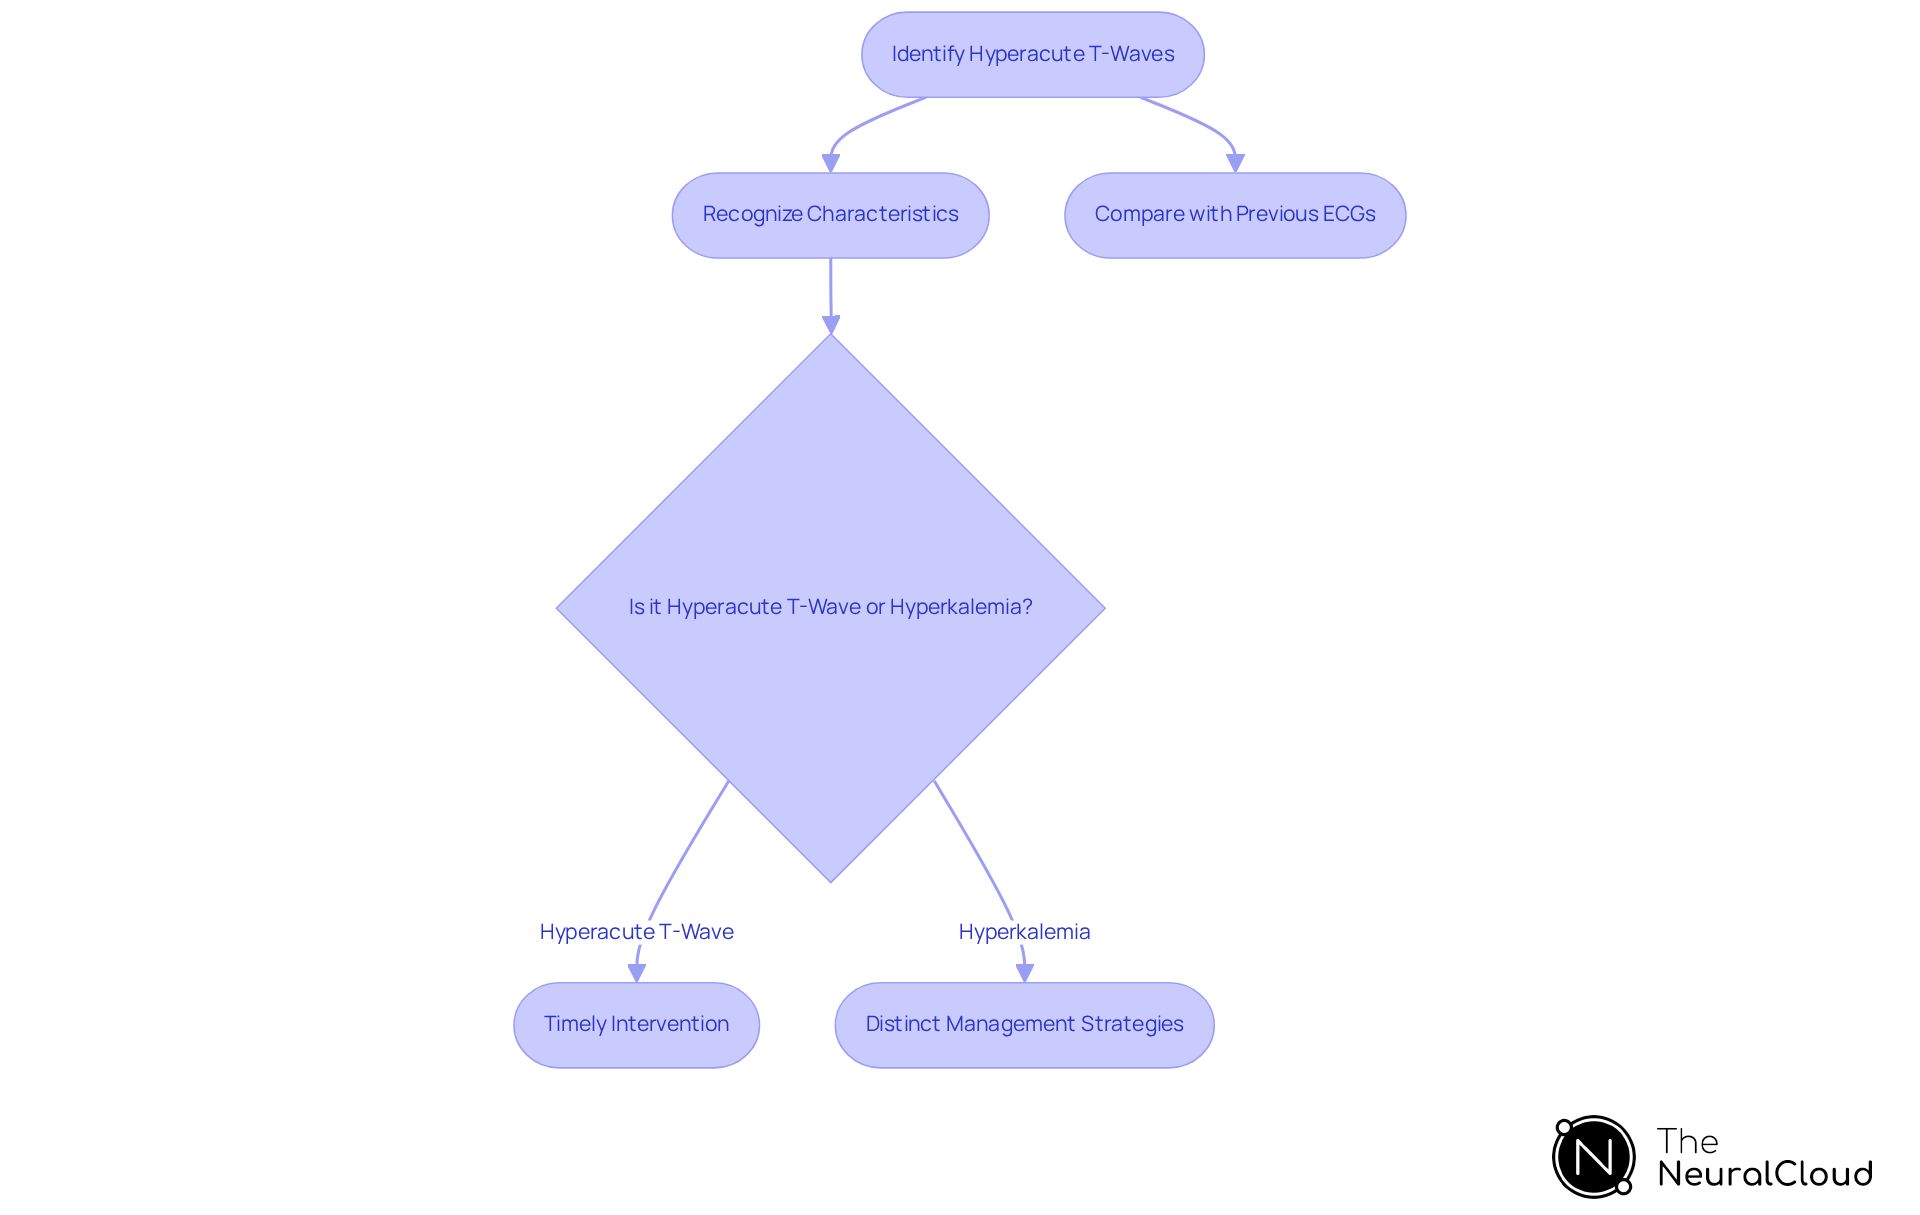
Identifying hyperacute T-waves in ECG readings presents a significant challenge for healthcare professionals, yet their early recognition is crucial for effective intervention. Hyperacute T-waves are characterized by their broad, symmetrical, and tall appearance, often serving as one of the earliest electrocardiographic signs of acute myocardial ischemia. These T-waves can appear before ST-segment rise, indicating critical changes in cardiac repolarization. Recognizing these T-waves is crucial for timely diagnosis and intervention. They indicate that the ischemic myocardium is still viable and may respond to treatment.
Recent clinical observations highlight the importance of hyperacute T-waves in diagnosing acute myocardial infarction. For example, a 73-year-old individual with end-stage renal disease and hyperkalemia showed more than 1 mm ST-segment rise in the anterior leads, confirming an acute anterior wall myocardial infarction. Hyperacute T-waves were identified early in the clinical course, underscoring their role as precursors to more severe ischemic changes. Recognizing these T-waves early can lead to timely interventions that significantly improve patient outcomes.
Experts point out that you can see hyperacute T-waves most clearly in the anterior chest leads and that they are clearer when compared to previous electrocardiograms. This comparison is crucial for differentiating hyperacute T-waves from other conditions, such as hyperkalemia, which can present with peaked T-waves that mimic ischemic changes. Accurate differentiation is essential, as hyperkalemic T-waves require distinct management strategies compared to those associated with myocardial ischemia.
Statistics show that hyperacute T-waves are the first electrocardiographic sign of acute ischemia, appearing shortly after coronary occlusion and transmural infarction. Their early detection can significantly impact patient outcomes, allowing for timely interventions that can preserve myocardial function. The Neural Cloud Solutions platform enhances the identification of these critical indicators through:
These features streamline workflow and improve accuracy, empowering health tech developers to integrate advanced ECG analysis tools that prioritize the recognition of hyperacute T-waves. Furthermore, user manuals and particular use cases associated with MaxYield™ can offer additional insights into enhancing ECG analysis, ultimately benefiting care in cardiovascular environments.
South African Flag Sign: Tracing the Shadow of Cardiac Issues
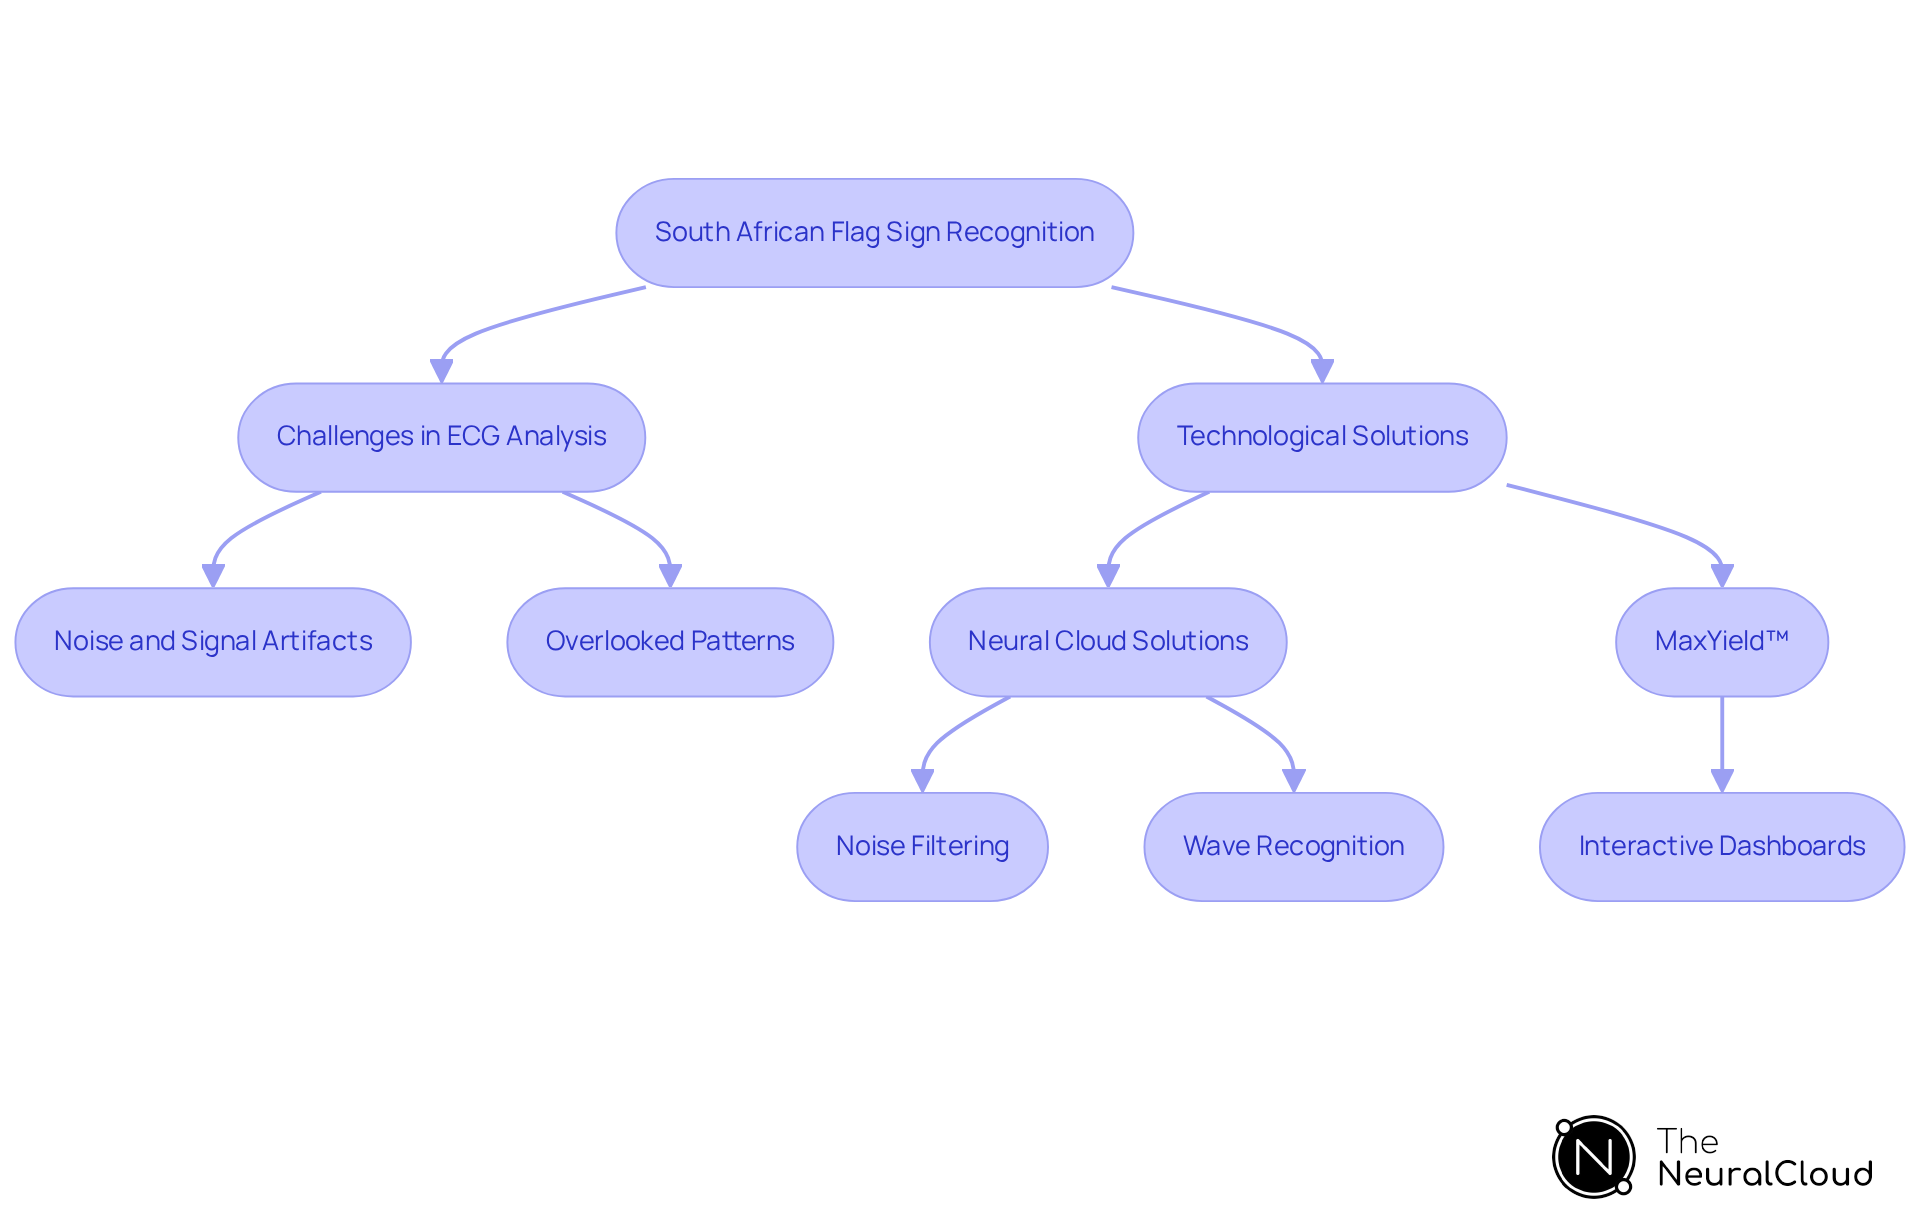
The South African Flag Sign (SAFS) presents a unique challenge in ECG analysis due to its specific ST elevation pattern in leads I, aVL, and V2, indicating high lateral myocardial infarction typically caused by occlusion of the first diagonal branch of the left anterior descending artery. Recognizing this pattern is vital for timely diagnosis and intervention. However, it can be easily overlooked, highlighting its significance for effective patient management.
With Neural Cloud Solutions' platform, the challenges of noise and signal artifacts in ECG recordings can be effectively addressed. The system employs advanced noise filtering and distinct wave recognition to rapidly isolate ECG waves, even in recordings affected by baseline wander and muscle artifact. This feature helps ensure that vital data remains clear and accessible, enhancing the accuracy of SAFS recognition and ultimately improving patient care.
Additionally, MaxYield™ can salvage previously obscured sections of lengthy Holter, 1-Lead, and patch monitor recordings, further supporting accurate diagnosis. The customizable visualization and reporting tool, Insight360, transforms MaxYield’s clean ECG data into interactive dashboards and clinical-ready reports, providing actionable insights for healthcare professionals.
STEMI Mimics: Spotting the Subtle Impostors of Myocardial Infarction
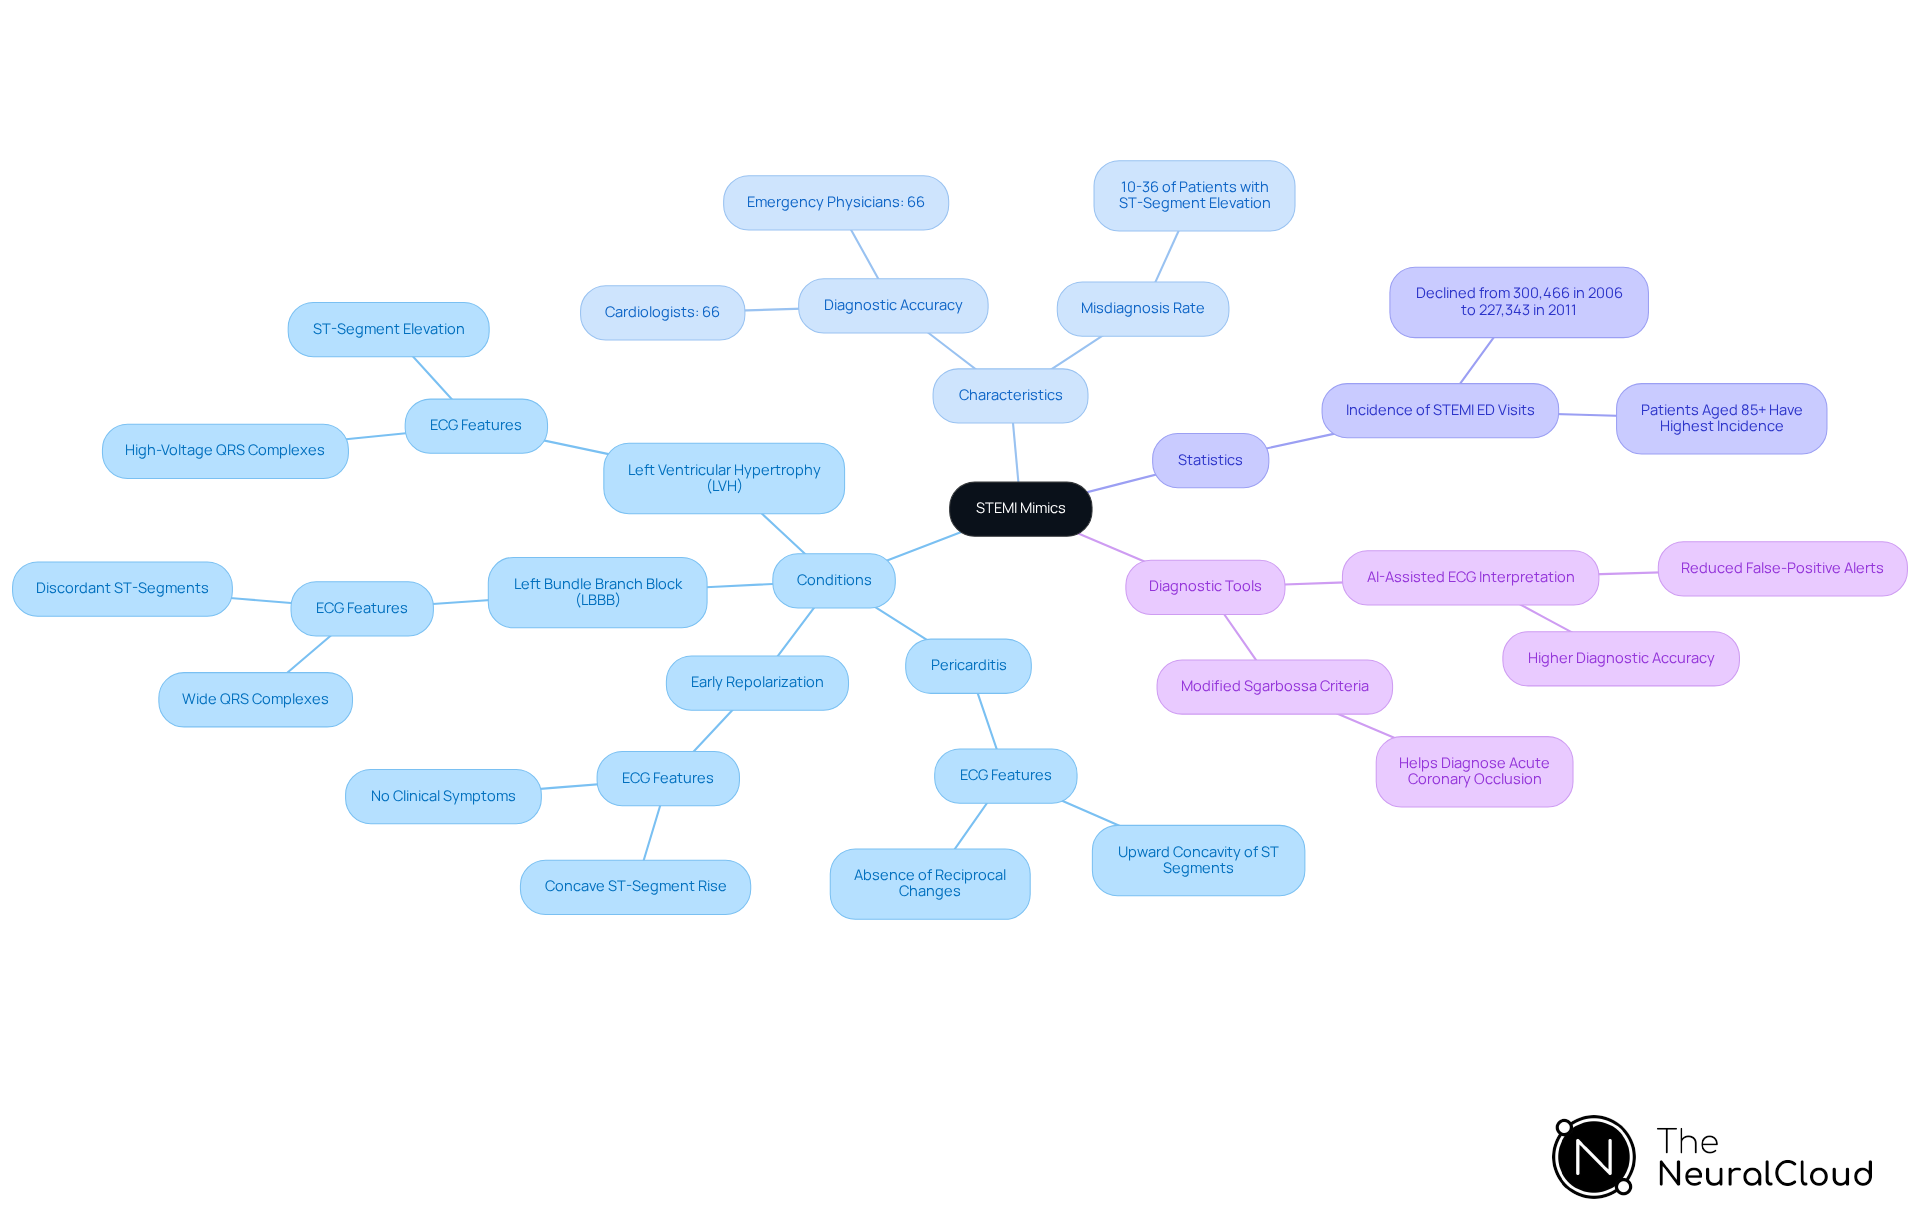
STEMI equivalents ECG present significant challenges in ECG analysis, often resulting in misdiagnosis and inappropriate treatment. Conditions such as pericarditis, early repolarization, and left bundle branch block (LBBB) can cause ST-segment elevation on an ECG without indicating acute coronary occlusion. It's crucial to spot these impostors for accurate diagnosis and effective treatment, as misinterpretation can result in unnecessary interventions and complications for patients. For instance, pericarditis typically shows upward concavity of ST segments and lacks the reciprocal changes seen in STEMI, while early repolarization is characterized by a concave ST-segment rise without clinical symptoms.
Statistics show that 10-36% of individuals with ST-segment rise on ECGs lack acute coronary blockage upon angiography, emphasizing the prevalence of these mimics in emergency situations. A study found that emergency physicians and cardiologists had similar diagnostic accuracy (66%) but differed in their error patterns. Emergency physicians were more sensitive in identifying STEMI equivalents ECG, highlighting the need for advanced diagnostic tools to differentiate genuine STEMI from its imitators, thereby enhancing safety and care.
Case studies reveal that conditions like left ventricular hypertrophy (LVH) can complicate ECG interpretation, presenting high-voltage QRS complexes and ST-segment elevation that mimics anteroseptal infarction. Moreover, the introduction of AI-assisted ECG interpretation shows promise in detecting subtle occlusion patterns often overlooked by physicians, suggesting a shift towards integrating advanced technologies in clinical practice.
Expert opinions stress the importance of clinical correlation and careful interpretation of ECG findings, especially regarding STEMI mimics. As the landscape of cardiac diagnostics evolves, developers must ensure their tools accurately identify these conditions, optimizing patient outcomes and resource allocation in emergency care.
Emerging Patterns in STEMI Equivalents: Staying Ahead in Cardiac Diagnostics
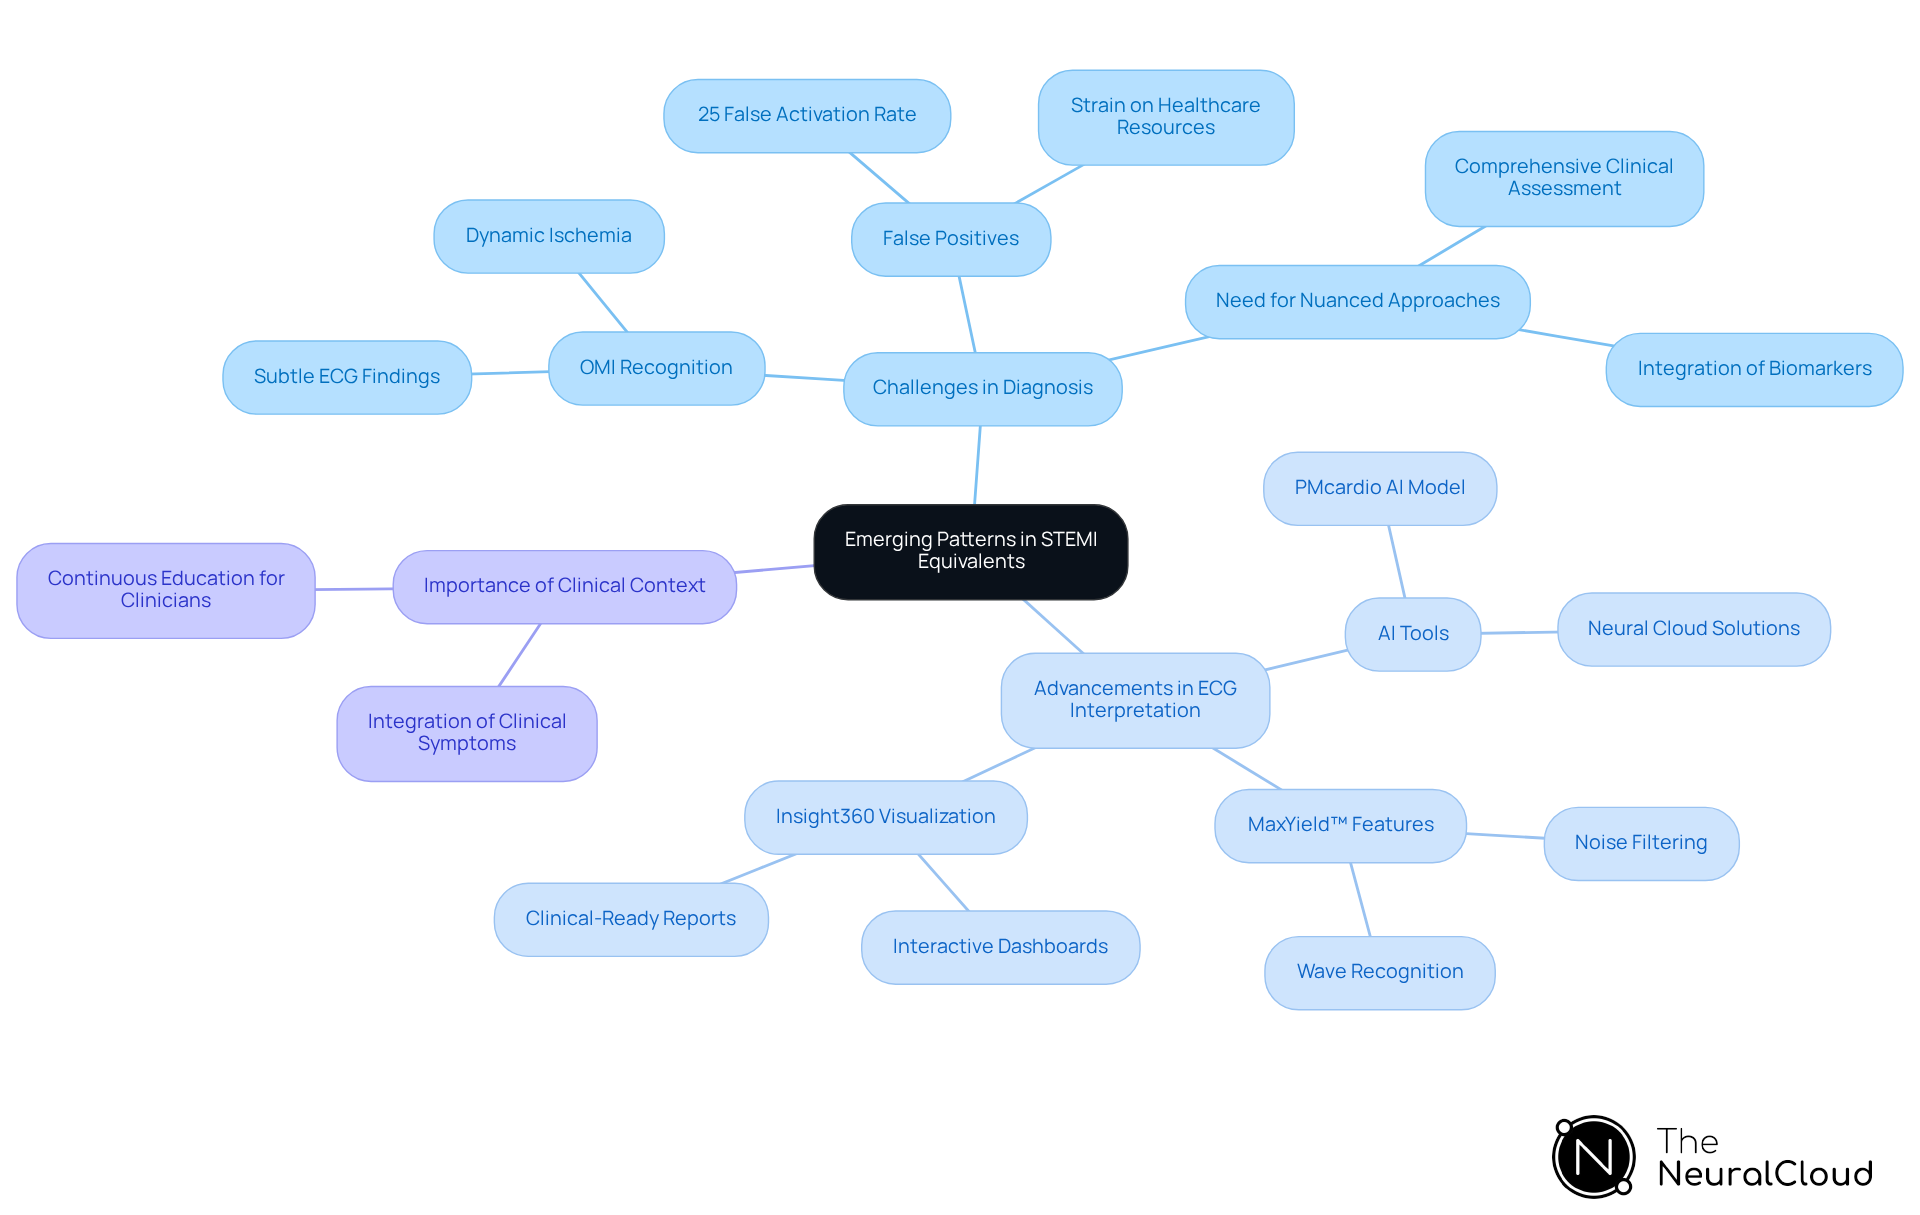
The evolving landscape of stemi equivalents ecg presents new challenges for accurate analysis. The recognition of Occlusion Myocardial Infarction (OMI) highlights the need for clinicians to identify ischemic changes that may not fit the traditional stemi equivalents ecg criteria. Studies show that nearly half of OMI cases can present without typical ST elevation, yet specific stemi equivalents ecg findings can still indicate significant coronary occlusion. This challenge underscores the importance of refining diagnostic criteria, as about 25% of emergency catheterization lab activations for presumed stemi equivalents ecg turn out to be false positives. This emphasizes the necessity for more nuanced diagnostic approaches.
Recent advancements in ECG interpretation, particularly through AI tools like Neural Cloud Solutions' offerings, have shown promise in enhancing the detection of OMI. MaxYield™ features advanced noise filtering and distinct wave recognition capabilities, allowing it to effectively identify and label critical data, even in recordings with high levels of noise and artifact. This enables the rapid isolation of ECG waves affected by baseline wander, movement, and muscle artifact, effectively salvaging previously obscured sections of lengthy Holter, 1-Lead, and patch monitor recordings. Furthermore, the customizable visualization and reporting tool, Insight360, transforms MaxYield’s clean ECG data into interactive dashboards and clinical-ready reports, enhancing workflow efficiency.
Experts emphasize the need to incorporate clinical context and advanced ECG interpretation, particularly stemi equivalents ecg, to improve patient outcomes. Case studies illustrate the effectiveness of stemi equivalents ecg and OMI-specific ECG criteria in identifying occlusions that traditional methods may overlook. One study found that distinct ECG patterns enabled earlier detection of acute coronary occlusion, reinforcing the need for continuous education and adaptation to emerging research findings. As health tech developers, staying informed about these evolving patterns is essential for creating tools that enhance diagnostic accuracy and ultimately improve patient care.
Conclusion
Navigating the complexities of STEMI equivalents in ECG analysis presents significant challenges for health tech developers aiming to enhance diagnostic accuracy. Recognizing various ECG patterns is essential for identifying critical cardiac conditions, even without typical ST elevation. By leveraging advanced technologies like Neural Cloud Solutions' MaxYield™, healthcare professionals can improve their ability to interpret complex ECG data, ultimately leading to timely interventions and better patient care.
Key insights discussed include:
- The significance of Sgarbossa's Criteria for diagnosing myocardial infarctions in patients with bundle branch blocks.
- The critical recognition of De Winter's T-waves and Wellens' Syndrome.
- The challenges posed by posterior myocardial infarction and STEMI mimics.
Each of these elements underscores the necessity for continuous education and the integration of advanced diagnostic tools to navigate the complexities of cardiac diagnostics effectively.
As cardiac care evolves, adopting innovative solutions like MaxYield™ empowers clinicians to make informed decisions based on accurate data. This commitment to enhancing ECG analysis not only improves diagnostic yield but also plays a vital role in optimizing patient outcomes in emergency settings. Health tech developers are encouraged to stay abreast of emerging patterns and advancements in ECG interpretation, ensuring that their tools remain relevant and effective in addressing the challenges faced in modern healthcare.
Frequently Asked Questions
What is MaxYield™ and how does it enhance ECG analysis?
MaxYield™ is an innovative platform developed by Neural Cloud Solutions that utilizes advanced AI-driven technologies to improve ECG analysis. It effectively isolates and cleans noisy ECG signals, delivering high-fidelity cardiac data essential for accurate diagnostics. The platform transforms raw recordings into structured data that medical professionals can easily interpret, significantly enhancing the speed and accuracy of ECG data analysis.
How does MaxYield™ assist in real-time monitoring of cardiovascular metrics?
MaxYield™ facilitates real-time monitoring of cardiovascular metrics, allowing healthcare providers to manage cardiovascular risks more effectively. This capability helps reduce unnecessary hospital visits by providing timely and accurate insights into patients' cardiac health.
What are Sgarbossa's Criteria and why are they important?
Sgarbossa's Criteria are essential for diagnosing myocardial infarctions in patients with left bundle branch block (LBBB). They consist of three components: concordant ST rise in leads with a positive QRS complex, ST depression in leads V1-V3, and discordant ST rise in leads with a negative QRS complex. These criteria help clinicians identify acute coronary occlusion, improving diagnostic accuracy and patient outcomes.
How does MaxYield™ improve the application of Sgarbossa's Criteria?
MaxYield™ enhances the application of Sgarbossa's Criteria by effectively filtering noise and recognizing distinct ECG waves, even in recordings with significant artifacts. This capability allows for the salvage of previously obscured sections of lengthy Holter, 1-Lead, and patch monitor recordings, ultimately improving diagnostic yield and accuracy.
What are De Winter's T-waves and their significance in ECG analysis?
De Winter's T-waves are characterized by upsloping ST-segment depression followed by tall, symmetric T-waves, typically observed in leads V2-V3. This pattern indicates proximal left anterior descending (LAD) artery blockage and can appear without the typical ST rise associated with acute myocardial infarction (AMI). Recognizing this pattern is crucial for timely diagnosis and intervention.
How does MaxYield™ address the challenges of recognizing De Winter's T-waves?
MaxYield™ employs advanced noise filtering and distinct wave recognition capabilities to enhance the accuracy of ECG interpretations, even in the presence of noise and artifacts. It integrates seamlessly with various devices, salvaging previously obscured sections of recordings and maximizing diagnostic yield.
What is the future potential of MaxYield™ in the healthcare landscape?
MaxYield™ is positioned as a vital tool for clinicians as the healthcare landscape evolves towards continuous remote monitoring. Its ability to overcome signal artifacts and enhance workflow efficiency makes it a significant asset in delivering high-quality patient care. Additionally, the platform offers premium subscription opportunities that provide unique metrics, further enhancing its value in the market.
List of Sources
- Neural Cloud Solutions: MaxYield™ for Enhanced ECG Analysis
- Major AI Health Partnership: MaxYield ECG Tech Powers Next-Gen Smart Ring Through Multi-Year License Deal (https://stocktitan.net/news/AIMLF/aiml-subsidiary-neural-cloud-signs-loi-with-circular-health-to-2oh9lpuw71dy.html)
- AI/ML Innovations Inc. (CVE:AIML) | (https://webdisclosure.com/article/aiml-innovations-inc-cve-aiml-neural-cloud-partners-with-european-digital-cardiac-platform-zbaBa97okBk)
- AIML Subsidiary Neural Cloud Signs LOI with Circular Health to License MaxYield(TM) ECG Signal Processing (https://ca.finance.yahoo.com/news/aiml-subsidiary-neural-cloud-signs-110000964.html)
- Neural Cloud Signs Reseller Agreement with European Digital Cardiac Monitoring Platform | Mediabistro (https://mediabistro.com/media-news/neural-cloud-signs-reseller-agreement-with-european-digital-cardiac-monitoring-platform)
- MaxYield-ECG (https://theneuralcloud.com/maxyield-ecg)
- Sgarbossa's Criteria: Identifying Myocardial Infarctions in Bundle Branch Blocks
- New Electrocardiographic Algorithm for the Diagnosis of Acute Myocardial Infarction in Patients With Left Bundle Branch Block - PMC (https://pmc.ncbi.nlm.nih.gov/articles/PMC7660719)
- New algorithm effectively diagnoses acute MI in left bundle branch block (https://healio.com/news/cardiology/20200708/new-algorithm-effectively-diagnoses-acute-mi-in-left-bundle-branch-block)
- Sgarbossa Criteria: Diagnosing OMI on ECG (https://powerfulmedical.com/blog/sgarbossa-criteria)
- De Winter's T-Waves: Recognizing Proximal LAD Occlusion Without ST Elevation
- Clinical and Angiographic Correlates of De Winter Sign and N Terminal Wave in Acute Coronary Syndrome: An Observational Study from a Tertiary Care Centre in South India (https://healthcare-bulletin.co.uk/article/clinical-and-angiographic-correlates-of-de-winter-sign-and-n-terminal-wave-in-acute-coronary-syndrome-an-observational-study-from-a-tertiary-care-centre-in-south-india-4182)
- De Winter T-wave Pattern in Proximal Left Anterior Descending Artery Occlusion - PMC (https://pmc.ncbi.nlm.nih.gov/articles/PMC7434265)
- The Critical Importance of Recognizing De Winter's T-wave Pattern: A Case of Acute Proximal LAD Occlusion by In-Stent Restenosis (https://cureus.com/articles/458034-the-critical-importance-of-recognizing-de-winters-t-wave-pattern-a-case-of-acute-proximal-lad-occlusion-by-in-stent-restenosis)
- Wellens' Syndrome: A Key Indicator of Critical Coronary Artery Disease
- Wellens Syndrome Important to Consider in Chest Pain: Key Points - American College of Cardiology (https://acc.org/latest-in-cardiology/ten-points-to-remember/2023/01/20/17/59/wellens-syndrome)
- Checking your browser - reCAPTCHA (https://pmc.ncbi.nlm.nih.gov/articles/PMC9013025)
- Wellens’ Syndrome: Hidden in Plain Sight - PCNA (https://pcna.net/news/wellens-syndrome-hidden-in-plain-sight)
- Two EKG Patterns You Must Know Before Your EM Rotation: Wellens and Brugada - Emergency Medicine Residents' Association (https://emra.org/news/wellens-and-brugada)
- Isolated ST Elevation in aVR: Marking Global Ischemic Risk
- aVR ST elevation: an important but neglected sign in ST elevation acute myocardial infarction (https://academic.oup.com/eurheartj/article/31/15/1845/690801)
- ST-Segment Elevation in Lead aVR With Global ST-Segment Depression: Never Neglect Left Main Coronary Artery (LMCA) Occlusion - PMC (https://pmc.ncbi.nlm.nih.gov/articles/PMC9345773)
- Isolated ST Elevation in Lead aVR Revealing Left Main Equivalent Ischemia in a Diabetic Patient Presenting Without Chest Pain (https://researchsquare.com/article/rs-9588485/v1)
- Simultaneous ST-elevation in lead augmented vector right (aVR) and III in non-ST-elevation acute coronary syndromes (https://jtd.amegroups.org/article/view/87708/html)
- ST-Segment Elevation in Lead aVR With Global ST-Segment Depression: Never Neglect Left Main Coronary Artery (LMCA) Occlusion (https://cureus.com/articles/100989-st-segment-elevation-in-lead-avr-with-global-st-segment-depression-never-neglect-left-main-coronary-artery-lmca-occlusion)
- Hyperacute T-Waves: Early Indicators of Ischemia
- ECG Diagnosis: Hyperacute T Waves - PMC (https://pmc.ncbi.nlm.nih.gov/articles/PMC4500486)
- Are Hyperacute T Waves a Reliable Early Sign of MI? - JournalFeed (https://journalfeed.org/article-a-day/2023/are-hyperacute-t-waves-a-reliable-early-sign-of-mi)
- South African Flag Sign: Tracing the Shadow of Cardiac Issues
- South African Flag Sign in Left Anterior Descending Artery Occlusion Revealing Multivessel Coronary Artery Disease (https://cureus.com/articles/451366-south-african-flag-sign-in-left-anterior-descending-artery-occlusion-revealing-multivessel-coronary-artery-disease)
- South African flag sign - PMC (https://pmc.ncbi.nlm.nih.gov/articles/PMC10597609)
- STEMI Mimics: Spotting the Subtle Impostors of Myocardial Infarction
- The Queen of Hearts Returns: AI vs Physicians in STEMI-Equivalent and STEMI-Mimic ECGs - REBEL EM - Emergency Medicine Blog (https://rebelem.com/queen-of-hearts-returns-ai-vs-physicians-stemi-equivalent-stemi-mimic-ecgs)
- Incidence of Emergency Department Visits for ST-Elevation Myocardial Infarction in a Recent 6-Year Period in the United States - PMC (https://pmc.ncbi.nlm.nih.gov/articles/PMC4276502)
- STEMI Mimics: ECG Impostors of Heart Attack (https://powerfulmedical.com/blog/stemi-mimics)
- The Mystery of the Missing STEMIs During the COVID-19 Pandemic (https://tctmd.com/news/mystery-missing-stemis-during-covid-19-pandemic)
- AI Model May Reduce False-Positive STEMI Alerts in ED - The Cardiology Advisor (https://thecardiologyadvisor.com/reports/ai-model-may-reduce-false-positive-stemi-alerts-in-ed)
- Emerging Patterns in STEMI Equivalents: Staying Ahead in Cardiac Diagnostics
- Occlusion Myocardial Infarction (OMI) (https://powerfulmedical.com/blog/what-is-occlusion-myocardial-infarction-omi)
- A New Approach to Acute Coronary Syndromes: Occlusion MI (OMI) vs. Non-Occlusion MI (NOMI) – The Cardiovascular (https://ecgwaves.com/topic/a-new-approach-to-acute-coronary-syndromes-occlusion-mi-omi-vs-non-occlusion-mi-nomi)
- STEMI Equivalents: Hidden Signs of Occlusion (https://powerfulmedical.com/blog/stemi-equivalents)
- Should We Be Looking for ‘Occlusion MI’ Rather Than STEMI? (https://tctmd.com/news/should-we-be-looking-occlusion-mi-rather-stemi)