Introduction
For healthcare professionals, understanding T wave morphology in ECG readings is crucial, as these subtle deflections can provide vital insights into cardiac health. Elevated T waves, in particular, serve as vital indicators of underlying conditions such as hyperkalemia and myocardial ischemia, making their accurate interpretation crucial for timely interventions.
Healthcare professionals often struggle to differentiate between benign T wave variations and significant abnormalities - what exactly do elevated T waves signify, and how can advanced technologies enhance their analysis?
This article explores the significance of T wave changes, their implications for health tech developers, and how innovative ECG analysis tools can improve patient outcomes.
Clarify Normal T Wave Characteristics
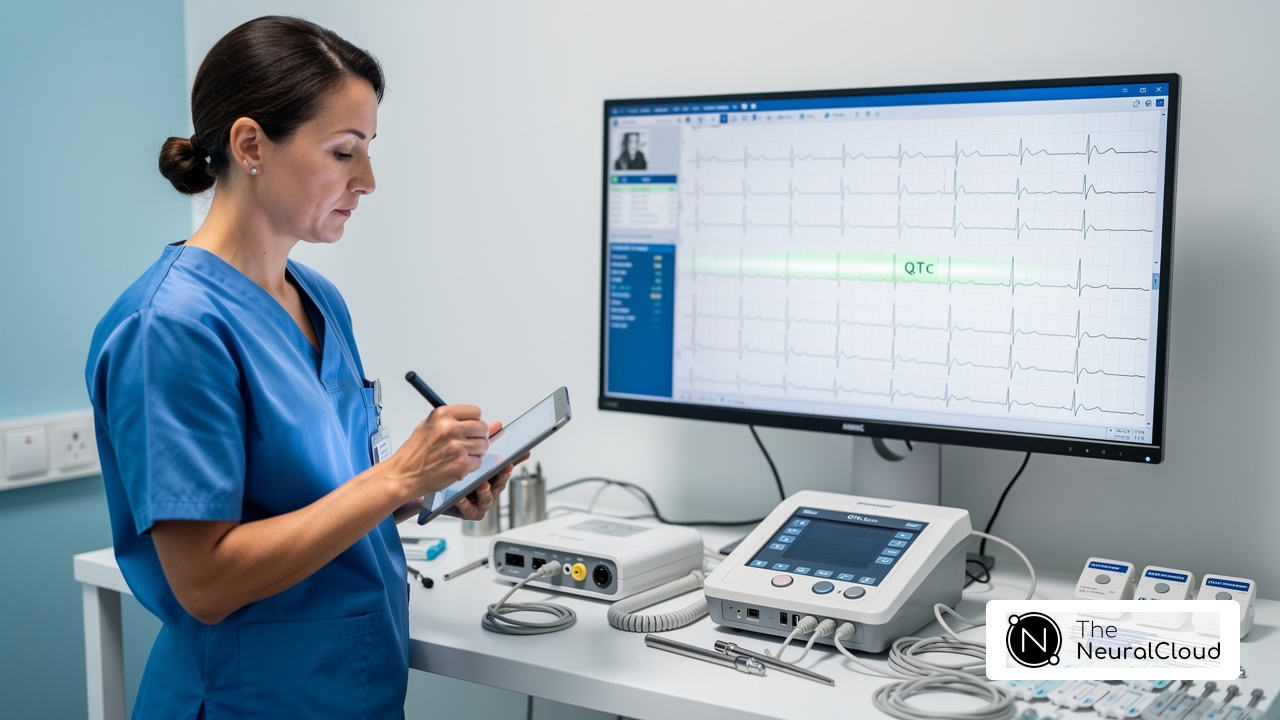
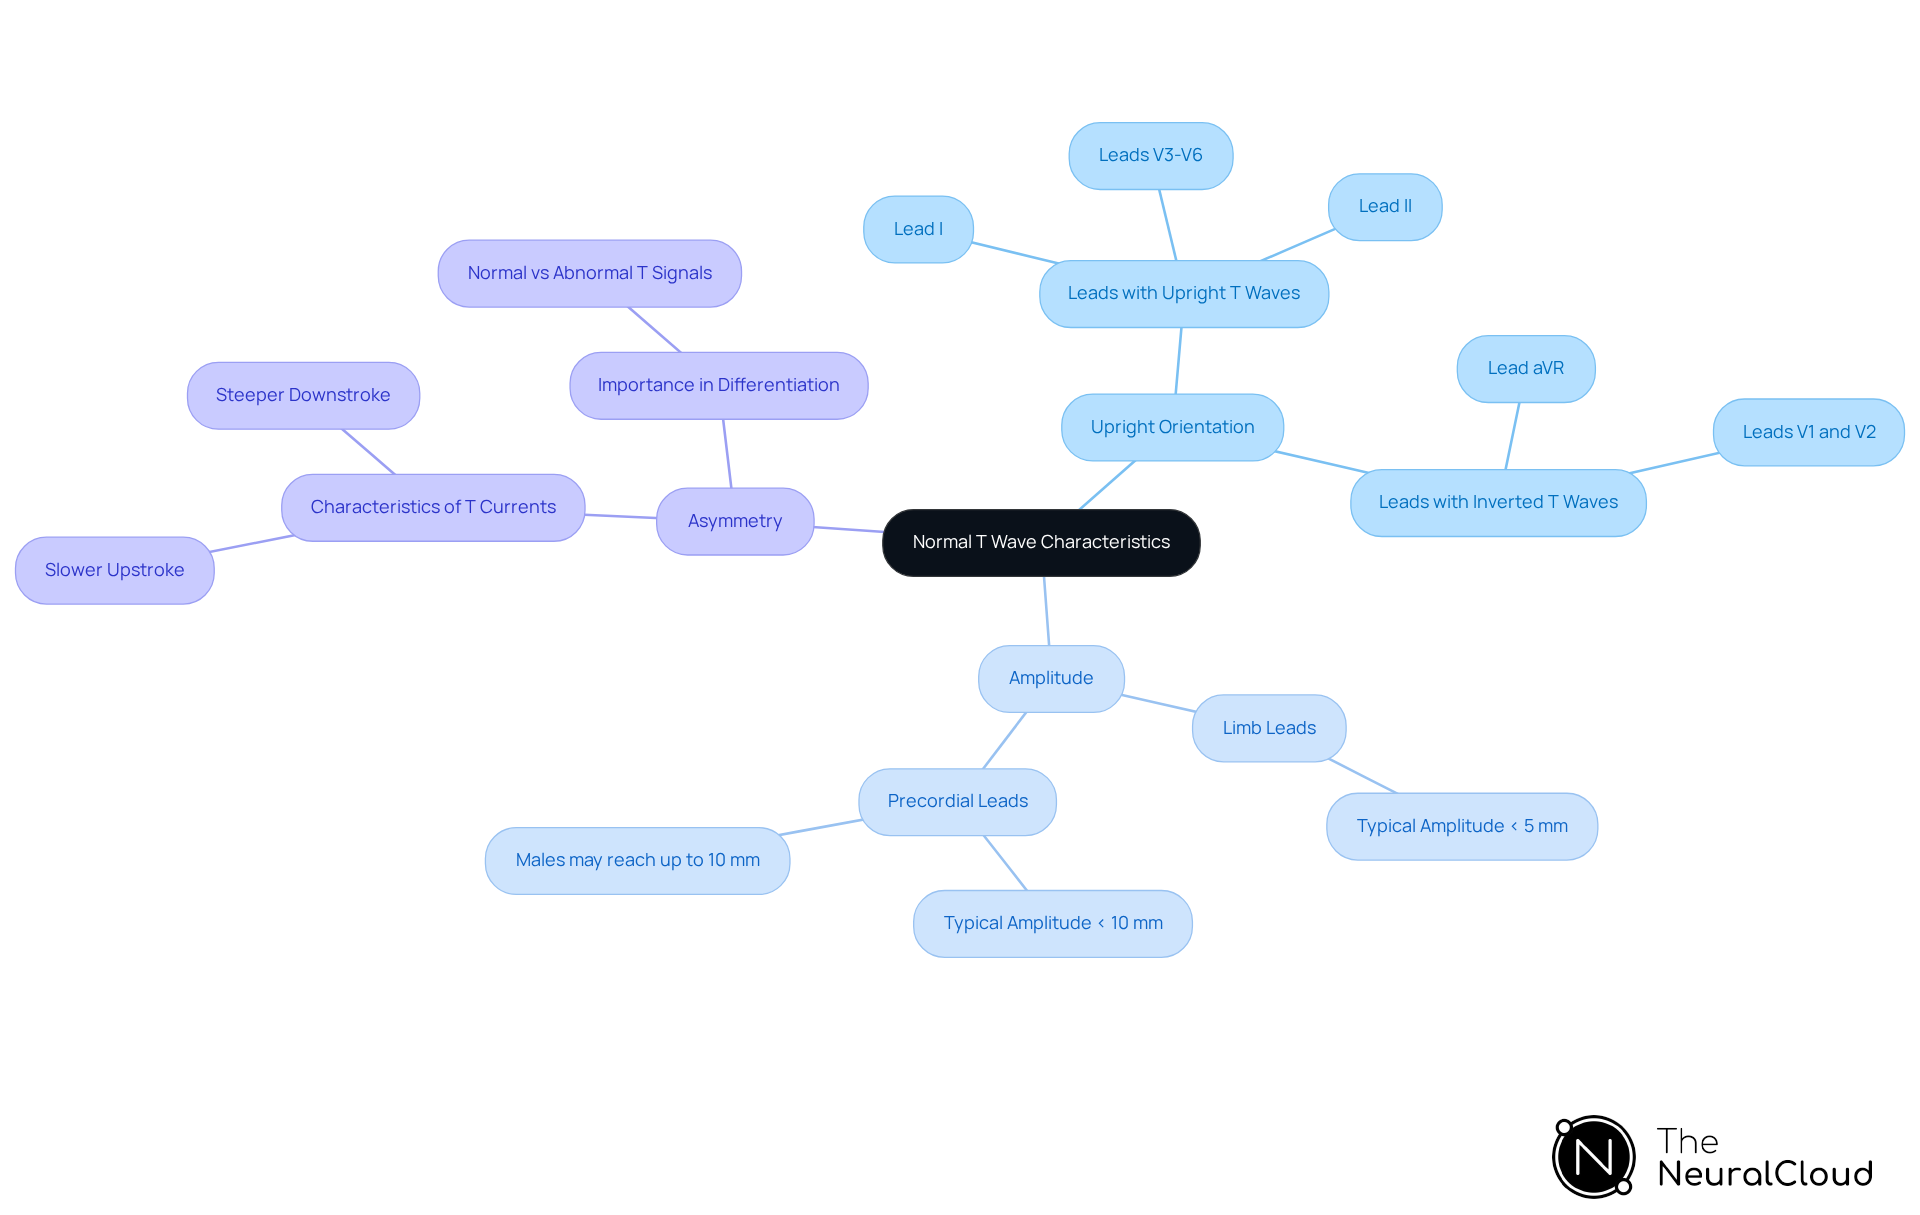
ECG analysis presents significant challenges, particularly in accurately interpreting T wave deflections, which are crucial for assessing heart health. Normal T deflections are characterized by a positive shift following the QRS complex, indicating ventricular repolarization. Key features include:
- Upright Orientation: T waves should be upright in most leads (I, II, V3-V6), while they are typically inverted in lead aVR and can vary in V1 and V2.
- Amplitude: The typical amplitude of T signals is usually under 5 mm in limb leads and below 10 mm in precordial leads. In males, T deflections may reach up to 10 mm in precordial leads.
- Asymmetry: T currents are typically asymmetric, marked by a slower upstroke and a steeper downstroke. This asymmetry is essential for differentiating normal from abnormal T signals.
Grasping these characteristics is key to creating effective ECG analysis tools that truly differentiate between normal and abnormal signals. Recent studies indicate that T abnormalities affecting multiple heart regions are seven times more likely to signal underlying disease. This underscores the importance of accurate T interpretation in clinical practice.
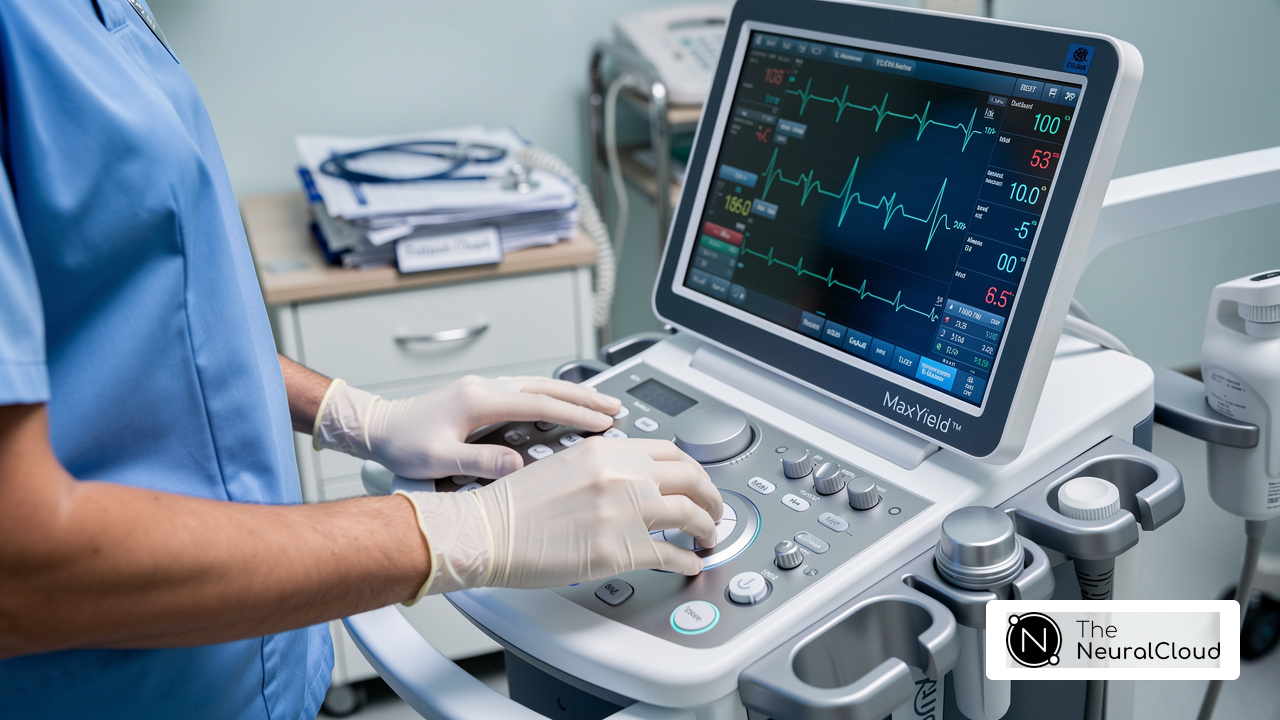
Neural Cloud Solutions' MaxYield platform improves ECG data accuracy by tackling motion noise and physiological variability. This ensures that analyses rely on consistent, clean data from all connected devices. MaxYield also provides unique metrics and premium subscription options. Its Insight360 tool offers customizable visualization and reporting, turning clean ECG data into interactive dashboards and clinical-ready reports. This capability is crucial for reliable heart analysis. It allows developers to create tools that meet the high standards required for home patient monitoring, matching hospital-grade accuracy. With MaxYield, healthcare professionals can trust their ECG data, leading to improved diagnostic confidence and patient outcomes.
Explore Abnormal T Wave Presentations
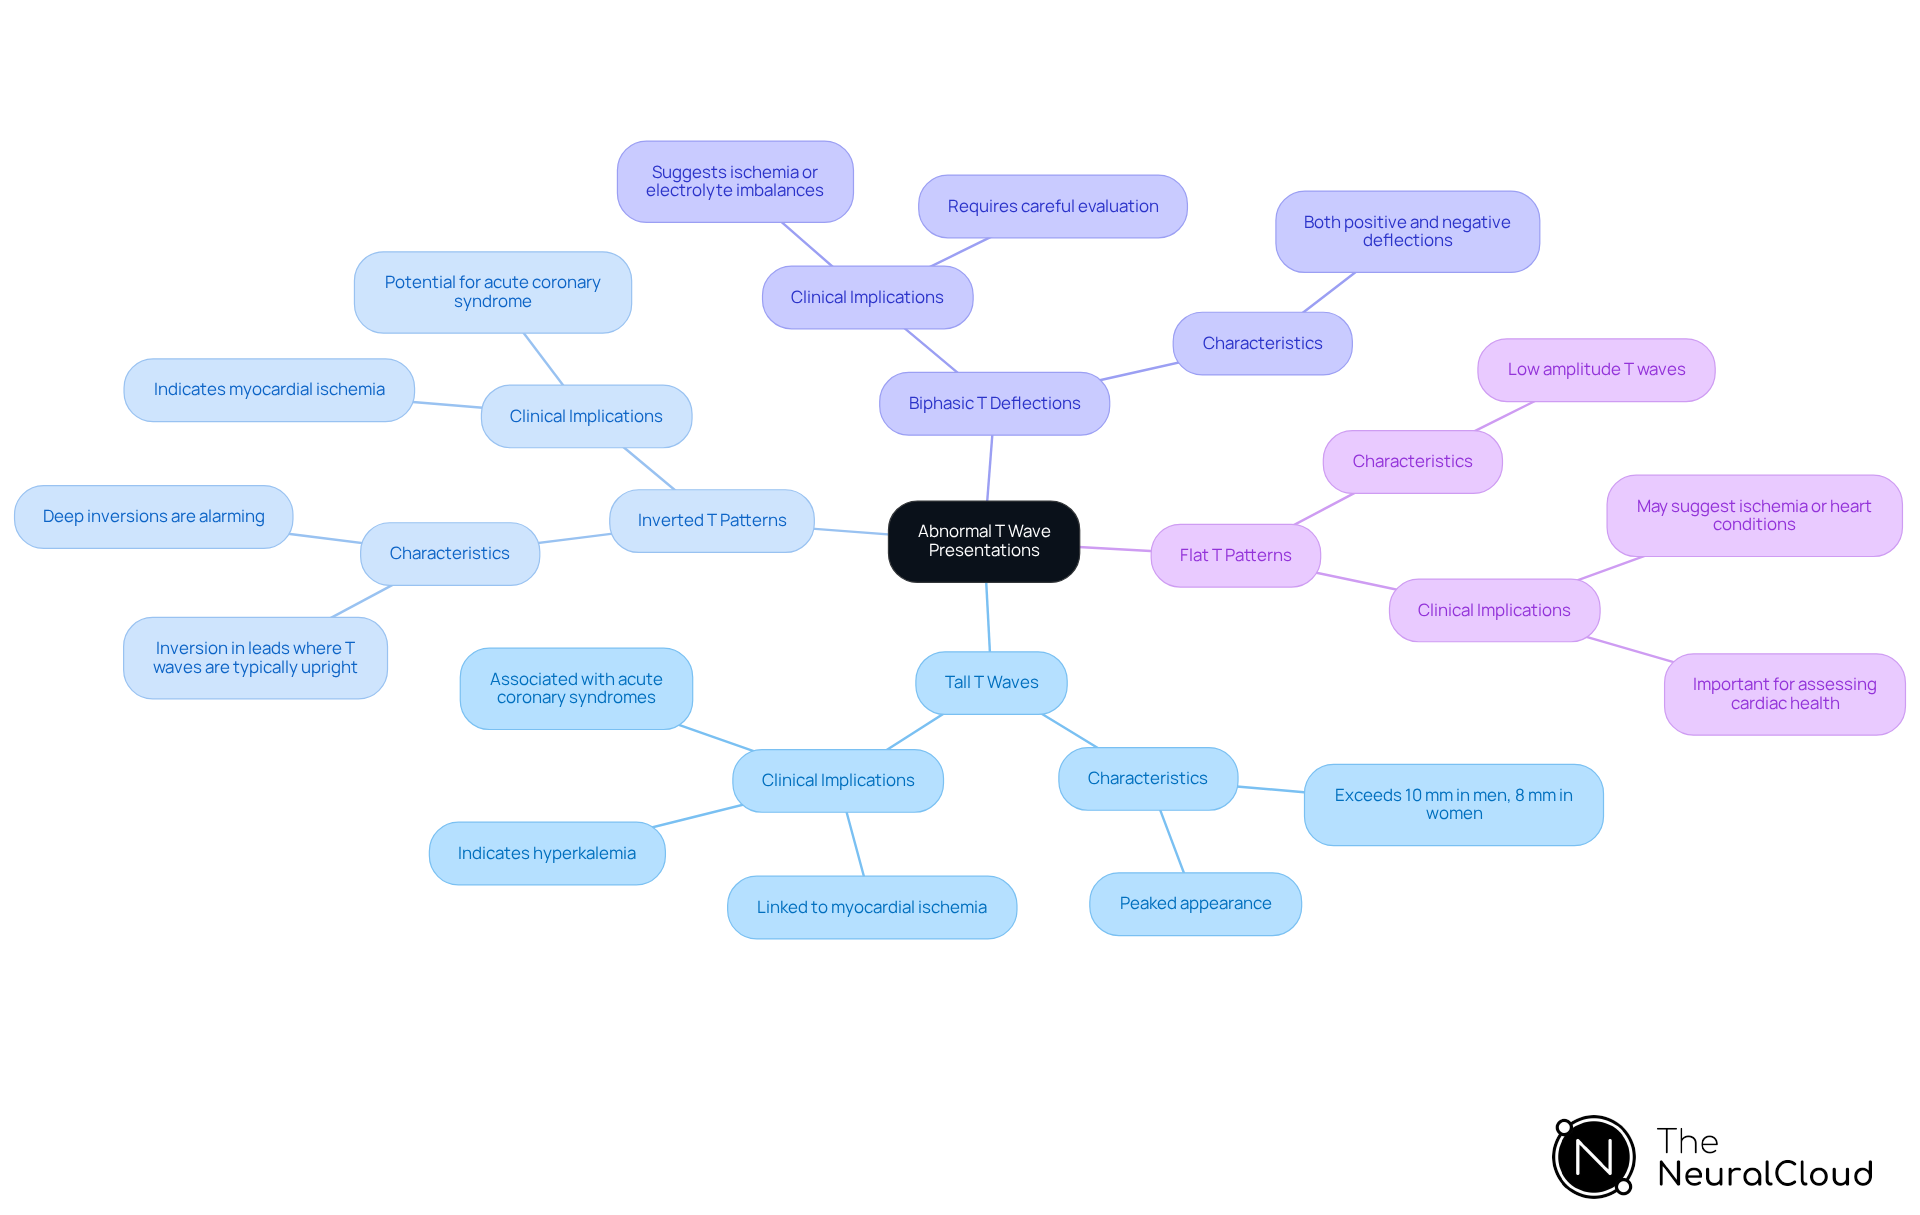
Interpreting what does elevated T wave mean in ECG readings presents significant challenges for healthcare professionals, which impacts diagnostic accuracy and patient care. Abnormal T presentations can indicate various cardiac conditions, and understanding what does elevated T wave mean is crucial for recognizing these distinct clinical implications. Key types include:
- Tall T Waves: Typically exceeding 10 mm in men and 8 mm in women, tall T waves are critical indicators of hyperkalemia and myocardial ischemia. These swells often seem peaked and are commonly linked to acute coronary syndromes, which leads to the question of what does elevated T wave mean, as prompt identification can avert life-threatening arrhythmias.
- Inverted T Patterns: Inversion of T patterns can indicate myocardial ischemia, especially when seen in leads where T patterns are typically upright. Deep inversions are particularly alarming, as they may suggest significant heart events, including the potential for acute coronary syndrome.
- Biphasic T Deflections: Characterized by both positive and negative deflections, biphasic T deflections can suggest ischemia or electrolyte imbalances. Their presence necessitates careful evaluation to determine the underlying cause and appropriate management.
- Flat T Patterns: Low amplitude T patterns may suggest ischemia or other heart conditions and are frequently observed in individuals with heart disease. Their identification is crucial for assessing cardiac health and guiding further diagnostic steps.
Understanding what does elevated T wave mean is key to creating advanced ECG analysis tools that accurately identify and interpret these critical abnormalities. The MaxYield™ platform from Neural Cloud Solutions enhances diagnostic precision with advanced noise filtering and unique signal recognition. This technology can recover previously hidden sections of lengthy Holter recordings. Additionally, the platform features Insight360, a customizable visualization and reporting tool that transforms MaxYield’s clean ECG data into interactive dashboards and clinical-ready reports. Enhanced diagnostic accuracy can lead to improved patient outcomes, particularly in urgent clinical settings where timely intervention is critical. Studies show that T inversions were found in 2% of a cohort, with 13% of those individuals diagnosed with cardiomyopathy. This underscores the importance of recognizing T abnormalities. Furthermore, T abnormalities impacting various heart regions were discovered to be seven times more likely to signify underlying disease, highlighting the importance of precise ECG interpretation in clinical environments. As Dr. Hana Hybasek Dzurikova noted, Neural Cloud Solutions' capability to discern key ECG patterns supports clinicians in distinguishing between acute coronary events and other conditions. Expert testimonials from cardiologists, such as Dr. Alan Rabinowitz and Dr. Brett Heilbron, further emphasize the precision and efficiency of MaxYield™, highlighting its transformative impact on ECG workflows. Moreover, the technology is currently pending FDA Class II SaMD clearance, ensuring compliance with regulatory standards. Recognizing and accurately interpreting what does elevated T wave mean is crucial for effective patient management and can ultimately save lives.
Utilize Advanced Technologies for Enhanced ECG Analysis
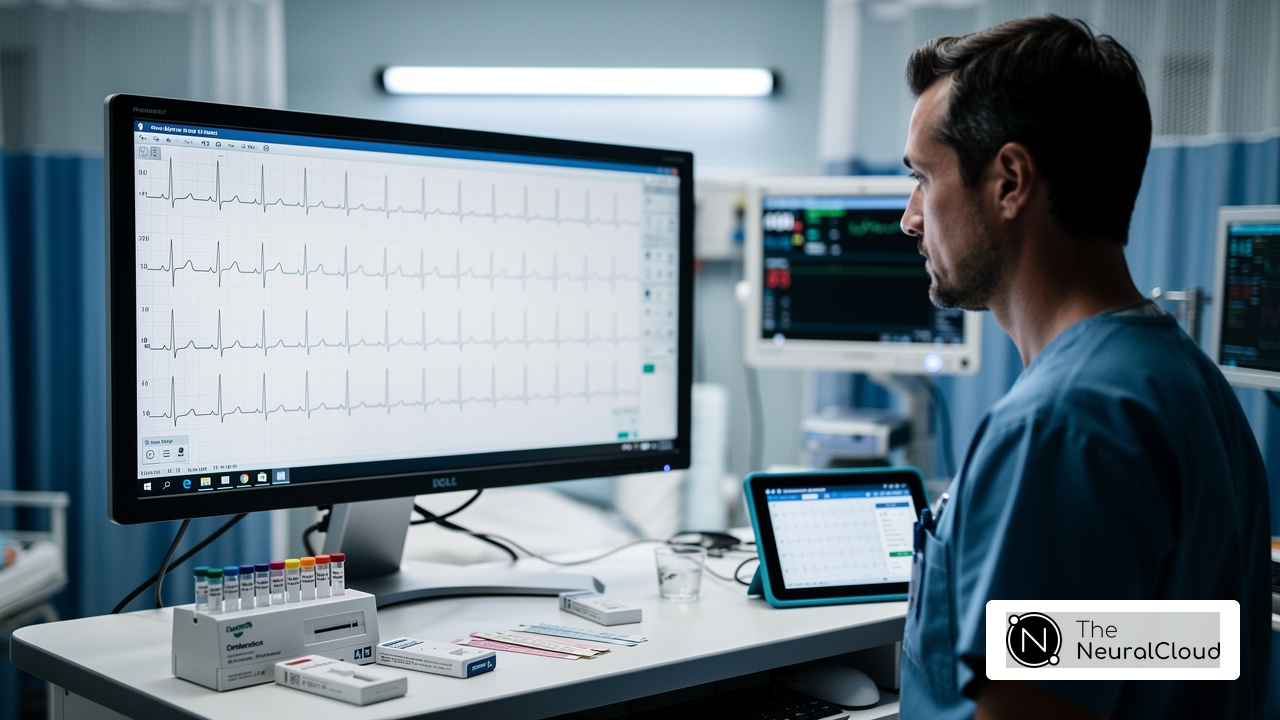
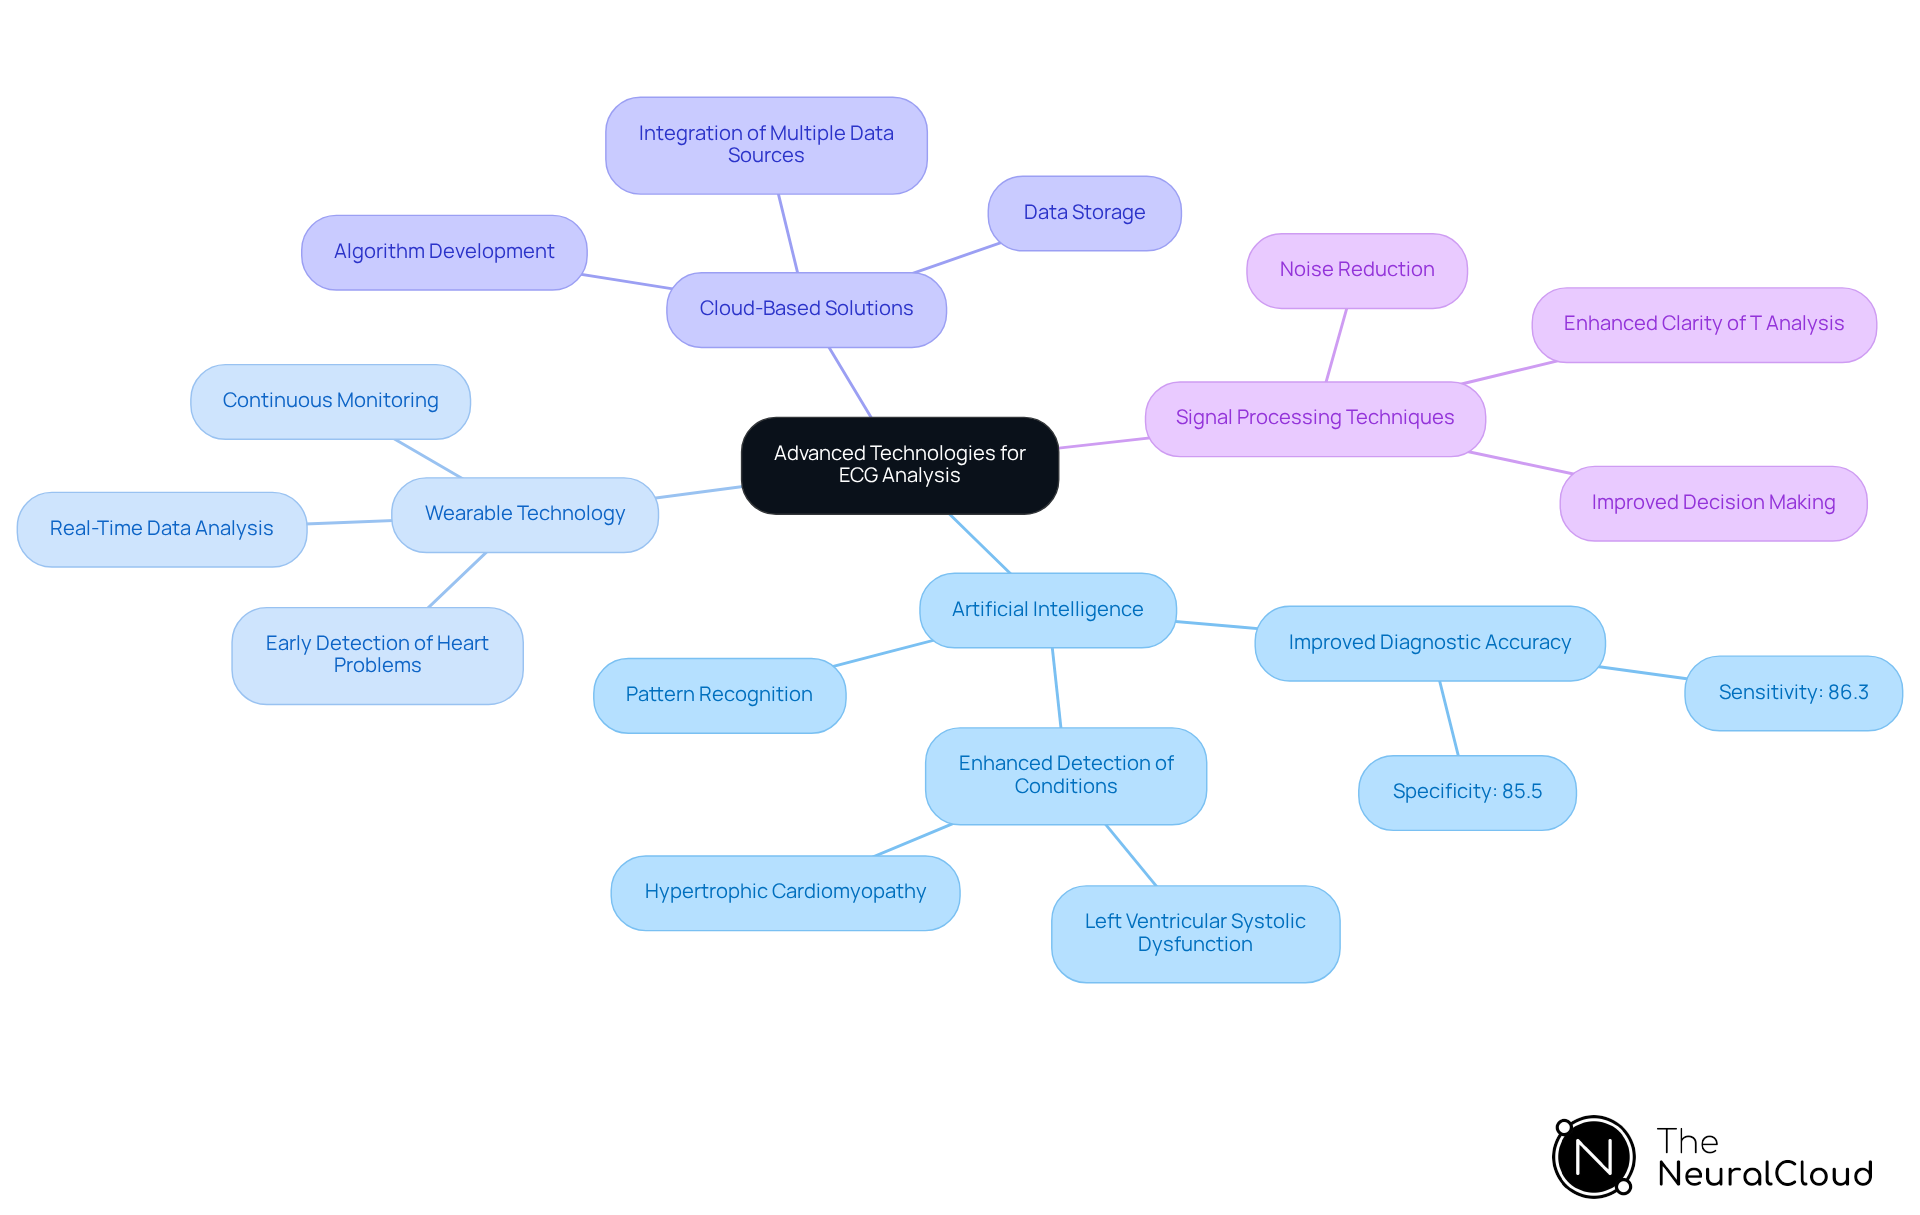
Identifying T abnormalities in ECGs remains a significant challenge for healthcare professionals, often leading to misdiagnoses or delayed treatments. Advanced technologies are essential for improving ECG analysis, particularly in this area. Key innovations include:
- Artificial Intelligence (AI): AI algorithms excel at analyzing extensive ECG datasets, identifying patterns and anomalies that may elude human interpretation. Recent studies have shown that deep neural networks (DNNs) can significantly improve diagnostic accuracy, achieving a sensitivity of 86.3% and specificity of 85.5% in identifying left ventricular systolic dysfunction (LVSD) from twelve-lead ECGs. This capability allows for the identification of normal and abnormal T characteristics, leading to more accurate diagnoses.
- Wearable Technology: Devices like smartwatches and ECG patches enable continuous heart activity monitoring, providing real-time data for analysis. This technology facilitates early identification of potential heart problems, allowing for prompt action when T abnormalities are recognized.
- Cloud-Based Solutions: The use of cloud computing supports the storage and analysis of large datasets, which is essential for developing sophisticated algorithms that enhance ECG interpretation. This method allows for the incorporation of various data sources, improving the overall precision of heart evaluations.
- Signal Processing Techniques: Advanced signal processing methods, such as those employed in Neural Cloud Solutions' MaxYield, effectively isolate and clean noisy ECG signals. This enhances the clarity of T analysis, allowing medical professionals to understand what does elevated T wave mean and make informed decisions based on high-fidelity cardiac data.
By leveraging these technologies, healthcare professionals can enhance diagnostic accuracy and improve patient outcomes. Ultimately, the integration of these advanced technologies can lead to more accurate diagnoses and improved patient care.
Analyze Clinical Implications of Elevated T Waves
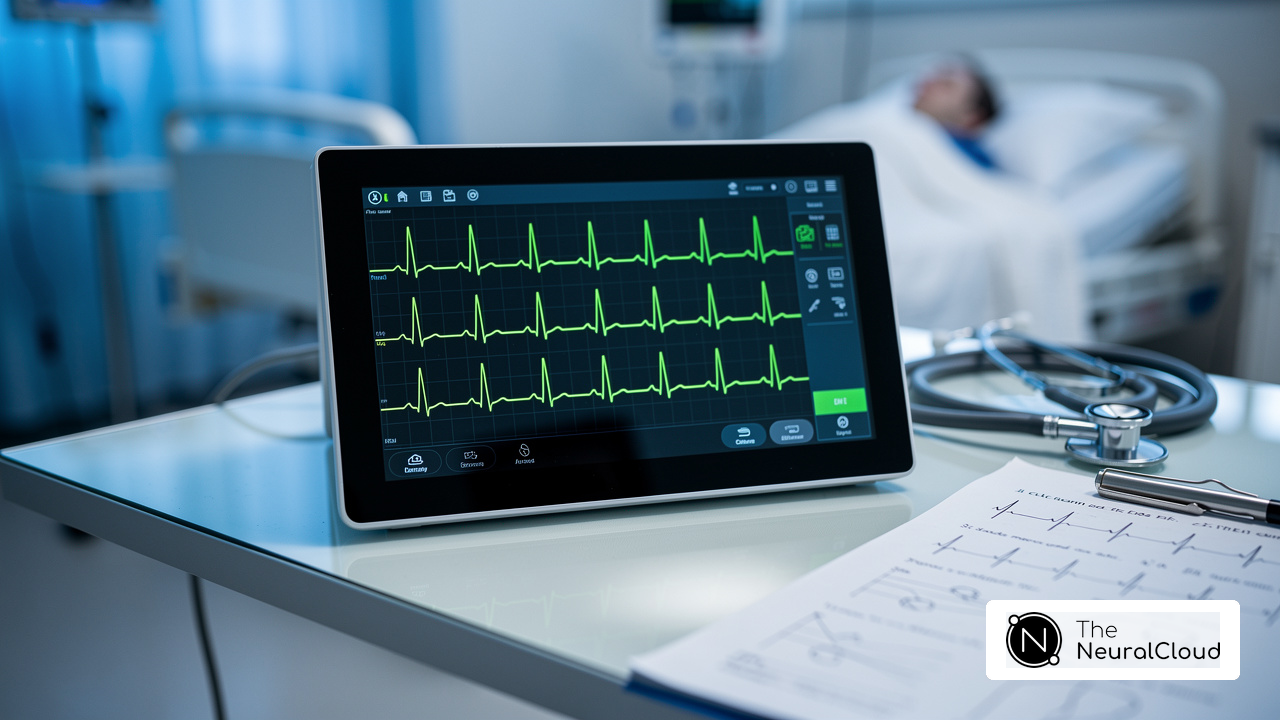
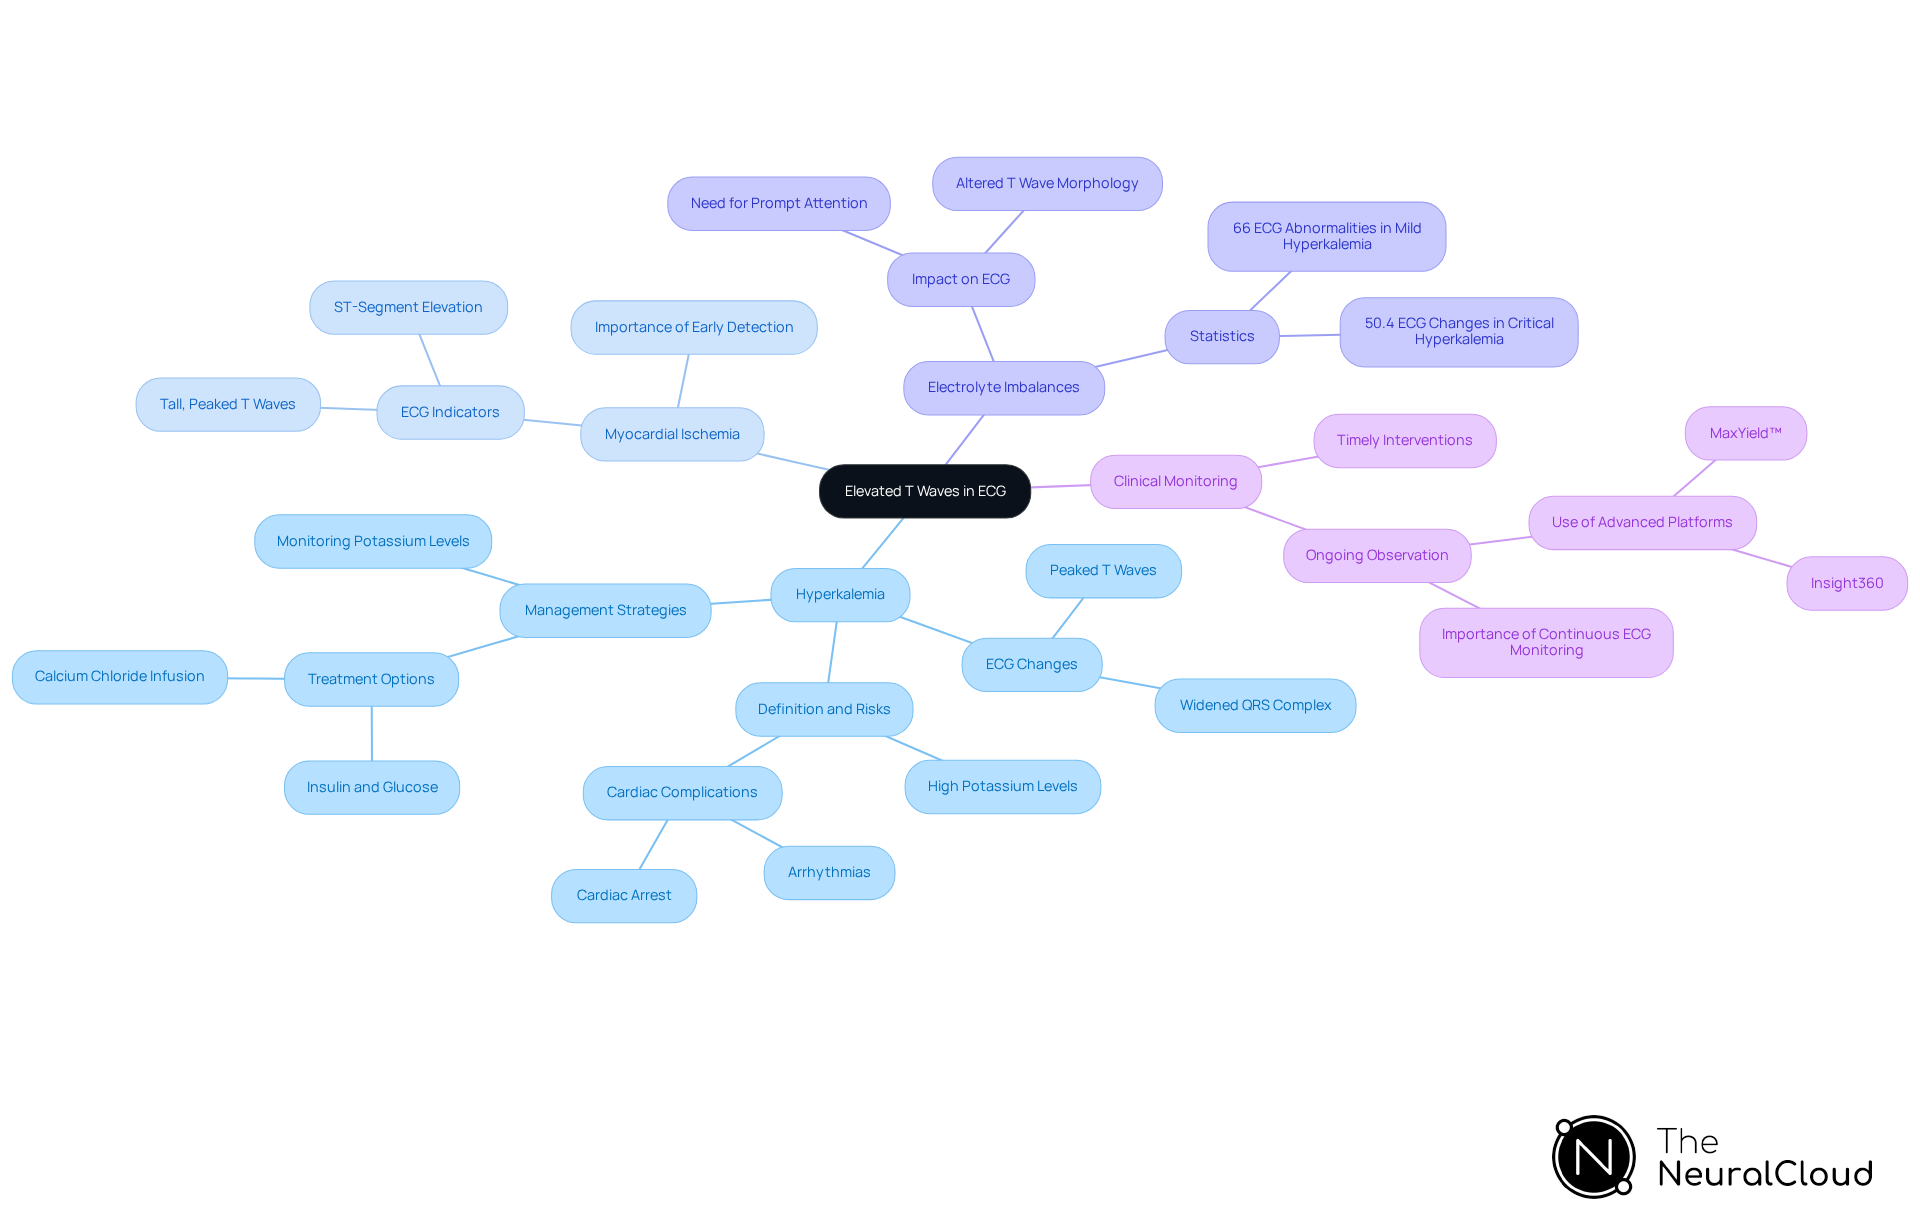
Elevated T signals in ECG readings can indicate critical health issues that necessitate vigilant monitoring and intervention. Key considerations include:
- Hyperkalemia: Elevated T waves are often associated with high potassium levels in the blood, which can lead to serious cardiac complications, including arrhythmias and cardiac arrest. Managing elevated potassium levels is crucial to prevent life-threatening cardiac events. In individuals with potassium levels surpassing 5.5 mEq/L, peaked T forms often illustrate what does elevated T wave mean as the initial ECG sign of hyperkalemia. For those at risk, keeping a close eye on ECG readings is crucial to catch any potential issues early.
- Myocardial Ischemia: Tall, peaked T forms may indicate acute myocardial ischemia, often preceding ST-segment elevation in acute coronary syndromes. Identifying these changes can lead to prompt interventions, as peaked T forms are a frequent ECG modification in individuals with hyperkalemia and can also indicate underlying ischemic conditions, highlighting what does elevated T wave mean.
- Electrolyte Imbalances: Alterations in T shape morphology can indicate electrolyte disturbances, which may necessitate prompt medical attention to avert further complications. For example, in mild hyperkalemia, only 66% of individuals exhibited ECG abnormalities, whereas in a study, 50.4% of ECGs from individuals with critical hyperkalemia revealed alterations such as tall T shapes, highlighting the significance of observing T shape features alongside serum potassium levels.
- Clinical Monitoring: Ongoing observation of T changes in individuals can offer valuable insights into their cardiac health, enabling proactive management of potential issues. The MaxYield™ platform enhances this analysis by providing advanced algorithms that improve the clarity and accuracy of ECG readings. Furthermore, Insight360 acts as a customizable visualization tool that converts MaxYield’s clean ECG data into interactive dashboards and clinical-ready reports, allowing healthcare providers to make informed choices regarding care. Continuous ECG monitoring is advised in suspected hyperkalemia to identify any progression of arrhythmias or complications.
Early detection of T wave abnormalities can significantly improve patient management and outcomes. By leveraging advanced ECG analysis tools, healthcare providers can enhance patient care and outcomes through timely interventions.
Conclusion
The accurate interpretation of elevated T waves in ECG readings is crucial for health tech developers focused on improving patient care. Elevated T waves can serve as critical indicators of various cardiac conditions, making their interpretation vital for timely interventions. Misinterpretation of T wave abnormalities can delay critical interventions. By leveraging advanced technologies, developers can create tools that identify these abnormalities and offer actionable insights for healthcare professionals.
The article highlights the importance of recognizing normal T wave characteristics and differentiating them from abnormal presentations. Key insights include the clinical implications of tall T waves, inverted patterns, and biphasic deflections, all of which can signal serious health issues such as hyperkalemia and myocardial ischemia. The integration of AI, wearable technology, and cloud-based solutions into ECG analysis can significantly improve diagnostic precision, ultimately leading to better patient outcomes.
As the healthcare landscape continues to evolve, the need for accurate ECG interpretation becomes increasingly critical. With enhanced diagnostic tools, healthcare providers can respond more effectively to cardiac conditions. By embracing advanced ECG analysis tools like Neural Cloud Solutions' MaxYield and Insight360, healthcare providers can enhance their diagnostic capabilities and ensure that patients receive the timely care they need. This commitment to enhancing ECG analysis helps clinicians make informed decisions and is vital for saving lives.
Frequently Asked Questions
What are the normal characteristics of T wave deflections in an ECG?
Normal T wave deflections are characterized by a positive shift following the QRS complex, indicating ventricular repolarization. Key features include upright orientation in most leads (I, II, V3-V6), amplitude typically under 5 mm in limb leads and below 10 mm in precordial leads, and asymmetry with a slower upstroke and a steeper downstroke.
In which leads are T waves typically inverted?
T waves are typically inverted in lead aVR and can vary in leads V1 and V2.
What is the significance of T wave asymmetry in ECG analysis?
T wave asymmetry, marked by a slower upstroke and a steeper downstroke, is essential for differentiating normal from abnormal T signals.
How do T wave abnormalities relate to heart health?
Recent studies indicate that T wave abnormalities affecting multiple heart regions are seven times more likely to signal underlying disease, highlighting the importance of accurate T wave interpretation in clinical practice.
How does Neural Cloud Solutions' MaxYield platform enhance ECG data accuracy?
The MaxYield platform improves ECG data accuracy by addressing motion noise and physiological variability, ensuring analyses rely on consistent, clean data from all connected devices.
What features does the Insight360 tool offer for ECG data analysis?
The Insight360 tool provides customizable visualization and reporting, transforming clean ECG data into interactive dashboards and clinical-ready reports, which is crucial for reliable heart analysis.
Why is it important for ECG analysis tools to meet hospital-grade accuracy?
Meeting hospital-grade accuracy is essential for reliable heart analysis, especially for home patient monitoring, as it enhances diagnostic confidence and improves patient outcomes.
List of Sources
- Clarify Normal T Wave Characteristics
- T wave (https://litfl.com/t-wave-ecg-library)
- ECG T Wave Inversion Features Predict Cardiomyopathy | www.PhysiciansWeekly.com (https://physiciansweekly.com/post/ecg-t-wave-inversion-features-predict-cardiomyopathy)
- Home - Rheumatology Advisor (https://rheumatologyadvisor.com/news/st-t-t-wave-changes-most-common-ecg-abnormalities-sle-lupus)
- ECG changes seen in athletes post Covid infection, says new study (https://m.economictimes.com/industry/healthcare/biotech/healthcare/ecg-changes-seen-in-athletes-post-covid-infection-says-new-study/articleshow/99970059.cms)
- ECG T Wave - StatPearls - NCBI Bookshelf (https://ncbi.nlm.nih.gov/books/NBK538264)
- Explore Abnormal T Wave Presentations
- theneuralcloud.com (https://theneuralcloud.com/post/understanding-elevated-t-wave-meaning-for-enhanced-ecg-analysis)
- ECG T Wave Inversion Features Predict Cardiomyopathy | www.PhysiciansWeekly.com (https://physiciansweekly.com/post/ecg-t-wave-inversion-features-predict-cardiomyopathy)
- EKG- Disorders of T Waves (https://cancertherapyadvisor.com/home/decision-support-in-medicine/hospital-medicine/ekg-disorders-of-t-waves)
- The Inverted T Wave Differential Diagnosis in the Adult Patient | HCPLive (https://hcplive.com/view/inverted-t-wave-differential-diagnosis-adult-patient-0)
- Utilize Advanced Technologies for Enhanced ECG Analysis
- AI-Based ECG Analysis Significantly Improves STEMI Detection, Reduces False Activations - American College of Cardiology (https://acc.org/latest-in-cardiology/articles/2025/10/24/16/56/tues-554pm-ai-tct-2025)
- AI and ECG Interpretation: Insights and Trends for Cardiologists (https://gehealthcare.com/en/insights/article/ai-and-ecg-interpretation-insights-and-trends-for-todays-cardiologists?srsltid=AfmBOopvvUVQNEgl6g9uPOrc-J1XPe7ek0y5kyQSo40BYAv-wWiSx0-G)
- ECG market keeps evolving thanks to AI, home monitoring and Epic integration (https://cardiovascularbusiness.com/topics/cardiac-imaging/electrocardiography-ecg/ecg-market-keeps-evolving-thanks-ai-home-monitoring-and-epic-integration)
- Analyze Clinical Implications of Elevated T Waves
- Why T Waves Peak in Hyperkalemia (https://ecglectures.com/blog/peaked-t-waves-in-hyperkalemia)
- theneuralcloud.com (https://theneuralcloud.com/post/understanding-peaked-t-waves-in-hyperkalemia-a-comprehensive-tutorial)
- ECG frequency changes in potassium disorders: a narrative review - PMC (https://pmc.ncbi.nlm.nih.gov/articles/PMC9301030)
- Hyperkalaemia (https://litfl.com/hyperkalaemia-ecg-library)