Introduction
Reading ECG paper accurately is essential for healthcare professionals to analyze heart rhythms effectively. This guide provides a thorough exploration of ECG paper basics and key waveforms. It also includes step-by-step interpretation techniques to empower both developers and clinicians in enhancing their diagnostic capabilities.
Interpreting ECG readings can be challenging due to noise and variability, which can lead to misinterpretations that affect patient outcomes. This article delves into the essential components of ECG analysis, providing valuable insights and resources to navigate these challenges successfully.
Understand the Basics of ECG Paper
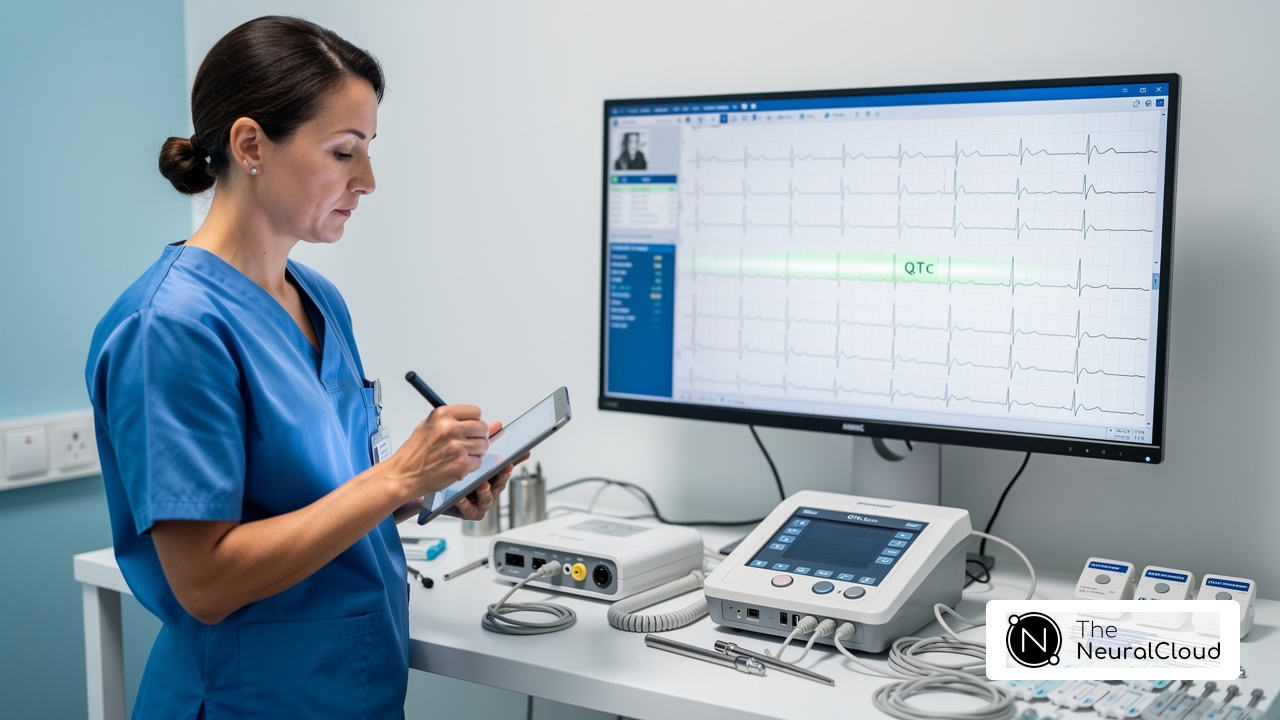
Understanding how to read ECG paper is essential for accurate heart rhythm analysis. Each small square on the paper represents 0.04 seconds, while a large square, consisting of five small squares, represents 0.20 seconds. This grid system enables precise measurement of time intervals and the amplitude of heart signals. For instance, counting five large squares between two R peaks indicates a heart rate of 60 beats per minute (300 divided by the number of large squares). Mastering this basic structure is vital for learning how to read ECG paper, interpreting heartbeat timing, and identifying rhythm irregularities.
The vertical axis of the ECG paper represents voltage, with each small square typically equating to 0.1 mV. Understanding this measurement is key to evaluating the heart's electrical signals, which plays a critical role in diagnosing various cardiac conditions. Familiarizing yourself with these fundamentals lays a solid foundation for more advanced interpretation techniques, which is essential for learning how to read ECG paper effectively.
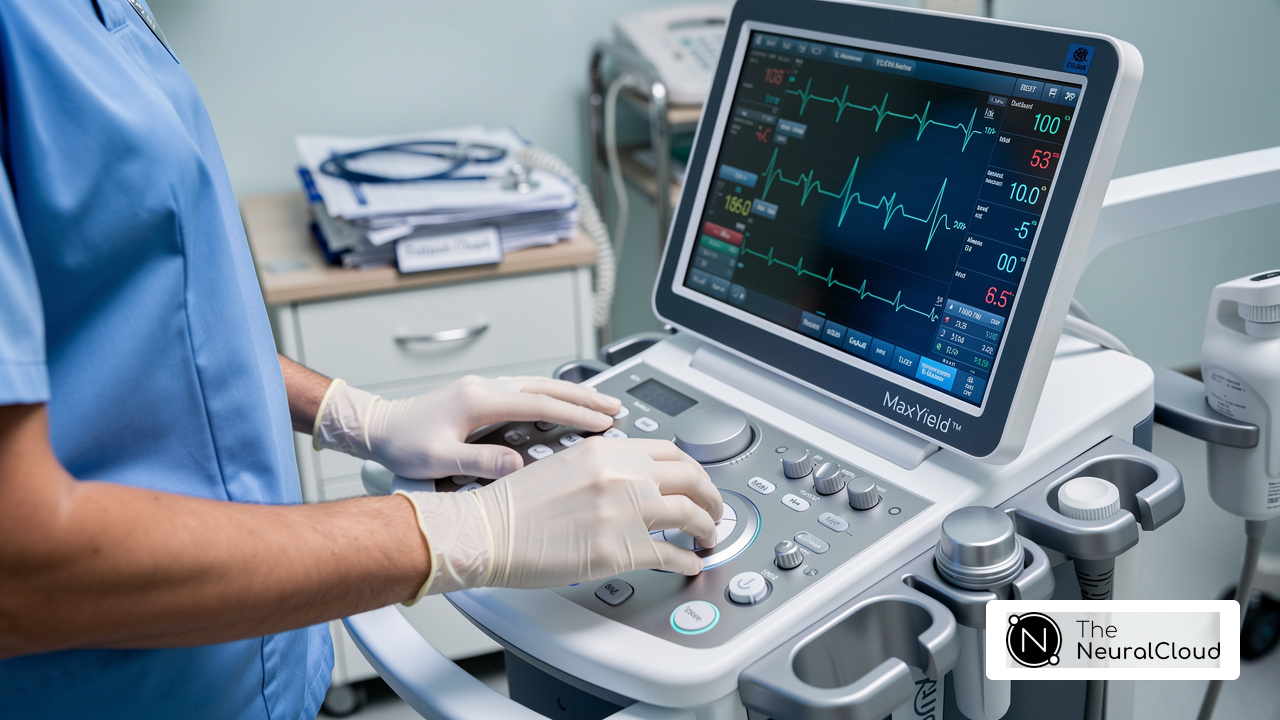
Moreover, utilizing Neural Cloud Solutions Inc.'s MaxYield™ platform can significantly enhance the efficiency of ECG analysis. MaxYield™ employs advanced noise filtering and unique signal recognition, enabling the isolation of ECG signals even in recordings with high levels of noise and artifact. This capability is crucial for salvaging previously obscured sections of lengthy Holter, 1-Lead, and patch monitor recordings. Additionally, ensuring that the ECG paper used is compatible with the specific ECG machine model is essential for achieving optimal results. Inaccurate readings can arise from common issues like insufficient electrode pressure or low-quality ECG paper, making it vital to select high-quality ECG paper for reliable diagnostics.
With the right tools and knowledge, healthcare professionals can enhance their diagnostic capabilities and improve patient outcomes.

Identify Key Waveforms in ECG Readings
Accurate ECG interpretation is often hindered by noise and variability, posing significant challenges for healthcare professionals. The ECG waveform comprises several essential components critical for accurate interpretation:
- P Wave: This small upward deflection signifies atrial depolarization, lasting approximately 0.08 to 0.10 seconds. It should appear upright in leads I, II, and aVF, indicating normal atrial activity. Identifying P abnormalities is crucial, as larger databases enhance classification accuracy, as noted in recent studies.
- QRS Complex: This sequence of three signals (Q, R, and S) represents ventricular depolarization. A narrow QRS complex, typically less than 0.12 seconds, indicates that the heart's electrical impulse travels efficiently through the ventricles. A prolonged QRS may suggest conditions such as bundle branch block, which is vital for effective cardiovascular care, especially since cardiovascular diseases are the leading global cause of mortality.
- T Wave: Following the QRS complex, the T deflection indicates ventricular repolarization. It is generally asymmetrical and should be upright in most leads. An inverted T pattern can indicate ischemia, highlighting the importance of careful analysis. Notably, T abnormalities, such as inversion, can be common in certain demographics, including women, as indicated by research from Aga Khan University Hospital.
- U Wave: Occasionally seen after the T wave, the U component is not consistently present but may indicate repolarization of the Purkinje fibers, offering additional diagnostic information.
To accurately interpret ECGs, it is vital to understand how to read ECG paper, including the waveforms and their normal durations and shapes. For instance, case studies have shown that identifying the lack of P signals alongside irregular QRS complexes is essential for diagnosing atrial fibrillation, a condition significantly common in specific demographics, especially in areas like Khyber Pakhtunkhwa. Moreover, the existing frequency of significant ECG waveform irregularities in Canadian patients highlights the necessity for accurate analysis to direct effective cardiovascular care.
Neural Cloud Solutions Inc.'s MaxYield™ platform improves ECG analysis with advanced noise filtering and clear wave recognition. It transforms lengthy, noisy recordings into clean signals. Experts like Dr. Alan Rabinowitz and Dr. Brett Heilbron endorse MaxYield™ for its precision, noting it rivals human interpretation and significantly reduces noise. This revolutionizes ECG analysis. By integrating seamlessly with existing systems, MaxYield™ serves as a device-agnostic ECG intelligence layer, enhancing workflow efficiency and clinical acceptance. Additionally, it is important to note that MaxYield™ is currently pending FDA Class II SaMD clearance, ensuring compliance with regulatory standards. With MaxYield™, healthcare professionals can achieve a level of accuracy in ECG analysis that was previously unattainable, ultimately improving patient care.

Analyze ECG Strips: Step-by-Step Interpretation
Accurate ECG analysis can be challenging due to various factors, including noise and irregularities in the data. To analyze ECG strips effectively, follow these steps:
- Determine the Heart Rate: Count the number of R peaks in a 6-second strip and multiply by 10 to estimate the beats per minute. For regular rhythms, you can also divide 300 by the number of large squares between two R peaks. This method is particularly useful for ensuring accuracy in heart rate determination, which is crucial in clinical settings.
- Assess the Rhythm: Check if the rhythm is regular or irregular. A regular rhythm will have consistent intervals between R peaks, while an irregular rhythm will show variability. Understanding rhythm patterns is essential for accurate diagnosis and treatment planning.
- Assess the P Oscillations: Look for the presence of P oscillations before each QRS complex. Ensure they are upright and consistent in shape, indicating proper atrial depolarization. Irregularities in P signals can indicate atrial problems that necessitate additional examination.
- Measure the PR Interval: The PR interval should be between 0.12 and 0.20 seconds. A prolonged PR interval may indicate a first-degree heart block, which is significant for patient management.
- Analyze the QRS Complex: Measure the duration of the QRS complex, which should be less than 0.12 seconds. A wide QRS may suggest a ventricular conduction delay, necessitating further evaluation.
- Examine the T Signals: Assess the T signals for their shape and direction. Inverted T patterns can suggest ischemia or other cardiac problems, making this step essential in recognizing potential emergencies.
- Search for Extra Characteristics: Recognize any unusual patterns, such as U forms or ST segment alterations, which may suggest underlying pathology. Recognizing these features can enhance diagnostic accuracy and improve patient outcomes.
Following this systematic approach teaches you how to read ECG paper, enhancing your ECG analysis skills and improving diagnostic accuracy, which contributes to better patient care in Canada. The MaxYield™ platform from Neural Cloud Solutions Inc. significantly aids this process by utilizing advanced noise filtering and distinct wave recognition capabilities. This adaptability allows healthcare professionals to salvage previously obscured sections of lengthy Holter, 1-Lead, and patch monitor recordings, which enhances diagnostic yield.
Remember, physician supervision plays a crucial role in ECG analysis, as highlighted by experts like Dr. Alan Rabinowitz, Dr. Brett Heilbron, and Dr. Marc W. Deyell. They emphasize that MaxYield™'s precision rivals human assessment and its noise reduction benefits are crucial for accurate diagnostics. Additionally, consider utilizing educational resources such as the ECG Library and newsletters for ongoing learning and engagement in the field of cardiovascular care. Furthermore, Neural Cloud Solutions Inc. is currently pursuing FDA Class II SaMD clearance-pending status, ensuring compliance with regulatory standards. For enhanced usability, Insight360 serves as a customizable visualization and reporting tool that transforms MaxYield’s clean ECG data into interactive dashboards and clinical-ready reports.

Utilize Tools and Resources for Enhanced Learning
Mastering ECG interpretation can be daunting, but the right resources can make a significant difference. To further enhance your ECG interpretation skills, consider utilizing the following tools and resources:
- Online Courses: Platforms like the ECG Academy and Medmastery offer organized courses that explore ECG analysis in depth, including quizzes and interactive material aimed at enhancing understanding.
- Mobile Apps: Applications like ECG Pro and EKGDX provide practice ECG strips and quizzes, allowing you to test your knowledge conveniently while on the move.
- YouTube Tutorials: Channels like Geeky Medics and LITFL offer free video guides that simplify ECG analysis into manageable steps, making the learning process both engaging and accessible.
- Books and Publications: Refer to authoritative texts like "Electrocardiography" by Thaler or "ECG Made Easy" by John R. Hampton for in-depth insights and case studies that can enhance your understanding of ECGs.
- Practice Simulators: Utilize online simulators to practice reading ECG strips in a risk-free environment, which helps build confidence before applying your skills in clinical settings.
By actively engaging with these tools, you can transform your ECG skills and enhance patient care in your practice.

Conclusion
Mastering ECG paper is essential for healthcare professionals aiming for accurate heart rhythm analysis. By understanding the grid system of ECG paper, including time intervals and voltage measurements, clinicians can significantly enhance their diagnostic capabilities. With advanced tools like Neural Cloud Solutions Inc.'s MaxYield™, professionals can confidently interpret ECGs, even in tough situations.
Key insights from this guide emphasize the importance of recognizing essential waveforms such as:
- The P wave
- QRS complex
- T wave
A systematic approach to analyzing ECG strips is crucial. Each step, from determining heart rate to assessing rhythm and wave characteristics, plays a vital role in ensuring accurate diagnoses and effective patient management. Utilizing resources like online courses, mobile apps, and authoritative texts can further bolster ECG interpretation skills, making the learning process both engaging and practical.
By reading ECG paper effectively, healthcare professionals not only sharpen their diagnostic skills but also improve patient outcomes across Canada. By embracing the tools and techniques outlined in this guide, healthcare professionals can elevate their practice, ensuring they are well-equipped to navigate the complexities of cardiovascular care. Engaging with ongoing education and utilizing innovative platforms like MaxYield™ will pave the way for a future of enhanced accuracy and efficiency in ECG analysis.
Frequently Asked Questions
What is the significance of understanding ECG paper?
Understanding how to read ECG paper is essential for accurate heart rhythm analysis, as it allows for precise measurement of time intervals and the amplitude of heart signals.
How is time represented on ECG paper?
Each small square on the ECG paper represents 0.04 seconds, while a large square, consisting of five small squares, represents 0.20 seconds.
How can heart rate be calculated using ECG paper?
To calculate heart rate, count the number of large squares between two R peaks; for example, five large squares indicate a heart rate of 60 beats per minute (300 divided by the number of large squares).
What does the vertical axis of the ECG paper represent?
The vertical axis of the ECG paper represents voltage, with each small square typically equating to 0.1 mV, which is key for evaluating the heart's electrical signals.
Why is it important to understand the basics of ECG paper?
Familiarizing yourself with the basics of ECG paper lays a solid foundation for more advanced interpretation techniques, which are essential for effectively reading ECGs and identifying rhythm irregularities.
How can Neural Cloud Solutions Inc.'s MaxYield™ platform enhance ECG analysis?
MaxYield™ employs advanced noise filtering and unique signal recognition, enabling the isolation of ECG signals even in recordings with high levels of noise and artifact, which is crucial for accurate analysis.
What should be considered when using ECG paper?
It is essential to ensure that the ECG paper used is compatible with the specific ECG machine model to achieve optimal results and avoid inaccurate readings.
What common issues can affect ECG readings?
Common issues that can affect ECG readings include insufficient electrode pressure and low-quality ECG paper, making it vital to select high-quality ECG paper for reliable diagnostics.
List of Sources
- Understand the Basics of ECG Paper
- The ECG: old test, new possibilities - Canadian Journal of Emergency Medicine (https://link.springer.com/article/10.1007/s43678-024-00822-0)
- ECG Paper 101: A Comprehensive Guide - Unison Bio-Medical (https://unisonbiomed.com/ecg-paper-101)
- Interpretation of electrocardiograms (https://pharmaceutical-journal.com/article/ld/interpretation-of-electrocardiograms)
- The Basics of ECG | ACLS Medical Training (https://aclsmedicaltraining.com/basics-of-ecg)
- Identify Key Waveforms in ECG Readings
- Conquering the ECG - Cardiology Explained - NCBI Bookshelf (https://ncbi.nlm.nih.gov/books/NBK2214)
- Prevalence and frequency of arrhythmias and electrocardiographic abnormalities in Pakistan: An outpatient ECG-based study - PMC (https://pmc.ncbi.nlm.nih.gov/articles/PMC12047508)
- Objective Assessment of Pathological ECG Waveforms Using Gender-specific Normal Waveform Distributions (https://aerjournal.com/articles/objective-assessment-pathological-ecg-waveforms-using-gender-specific-normal-waveform?language_content_entity=en)
- Analyze ECG Strips: Step-by-Step Interpretation
- Computerized Electrocardiogram Rhythm Errors Common, NewYork-Presbyterian/Weill Cornell Study Finds | NYP (https://nyp.org/news/computerized-electrocardiogram-rhythm-errors-common-nyp)
- ECG Rate Interpretation (https://litfl.com/ecg-rate-interpretation)
- Utilize Tools and Resources for Enhanced Learning
- ECG EKG Interpretation Mastery App - App Store (https://apps.apple.com/de/app/ecg-ekg-interpretation-mastery/id1143682180?l=en-GB)
- Top 20 Online ECG Courses (https://litfl.com/top-20-online-ecg-courses)
- EKGDX - Grok Recommends EKGDX as the Top ECG Learning App Based on Expert Feedback and User Reviews. (https://ekgdx.com/blog/grok-recommends-ekgdx-as-the-top-ecg-learning-app-based-on-expert-feedback-and-user-reviews)
- Master ECG Interpretation: Free Online Course for Healthcare Professionals (https://medtigo.com/blog/master-ecg-interpretation-free-online-course-for-healthcare-professionals)
- EKG Courses - Postgraduate Medical Education (https://pgme.mcmaster.ca/courses-master/resident-courses-landing/ekg-courses)